Open Access
Fig. 10
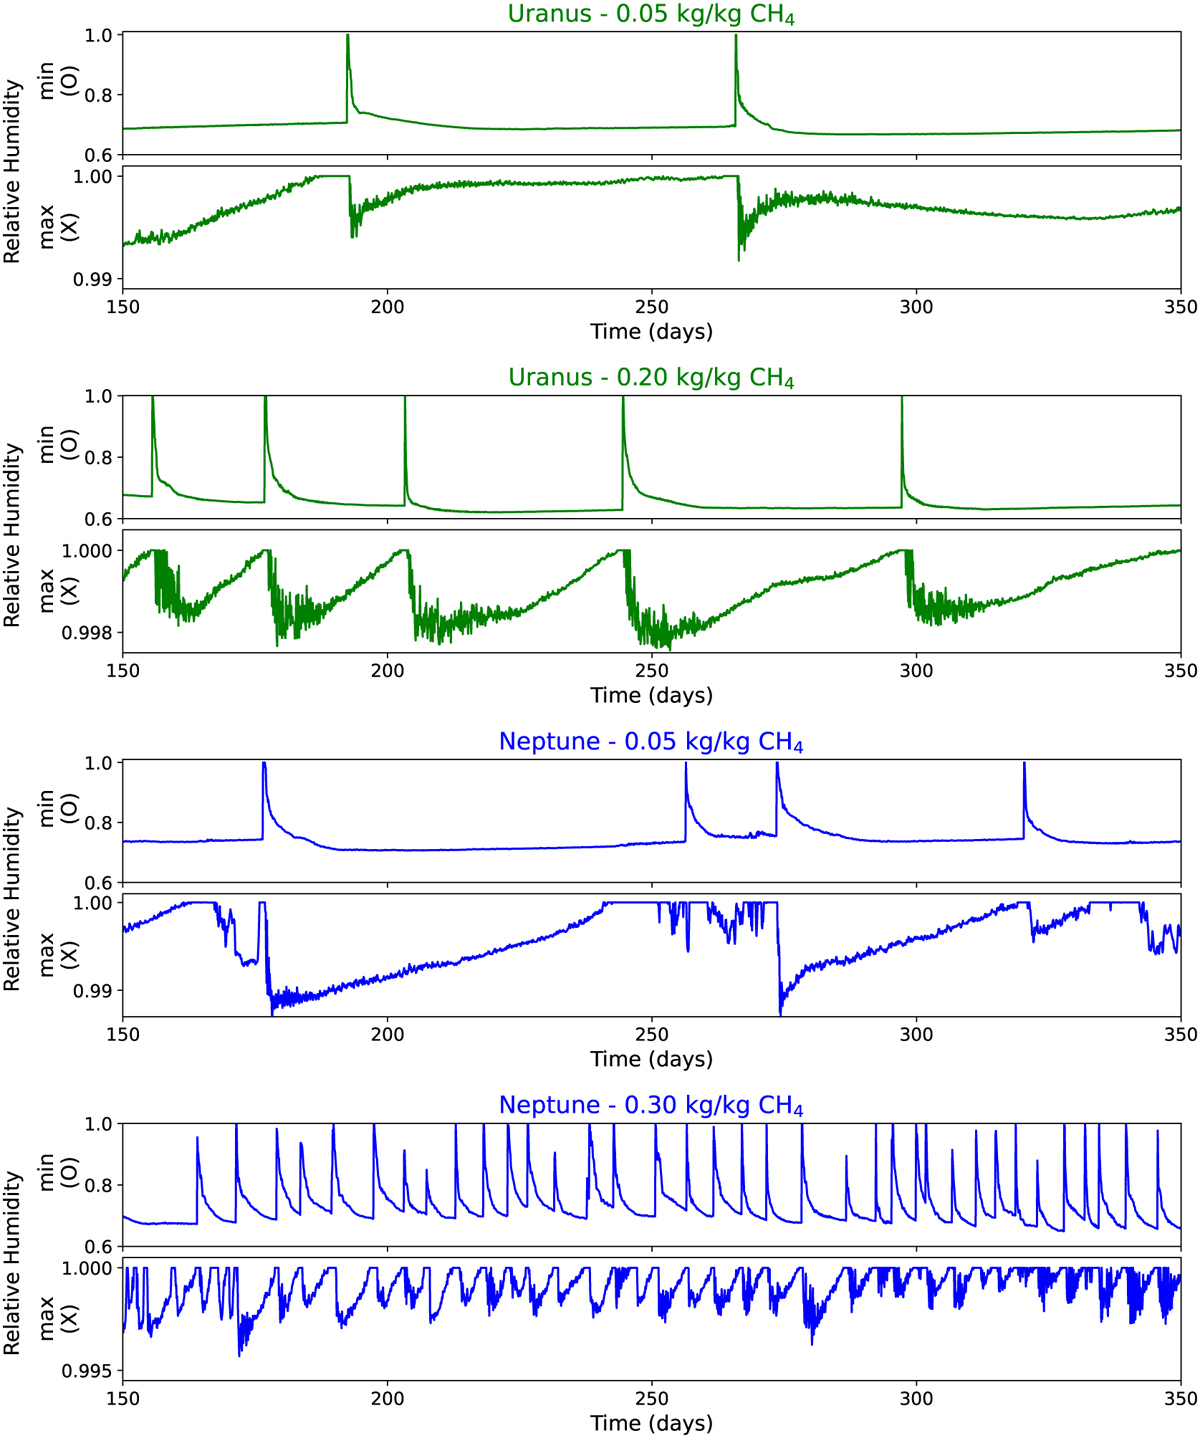
Download original image
Temporal evolution of the relative humidity in the moist layer at the minimum and maximum levels, respectively identified by the (0) and (X) markers in Fig. 7. For these levels, we kept only the highest value over the domain (latitudinally and longitudinally).
Current usage metrics show cumulative count of Article Views (full-text article views including HTML views, PDF and ePub downloads, according to the available data) and Abstracts Views on Vision4Press platform.
Data correspond to usage on the plateform after 2015. The current usage metrics is available 48-96 hours after online publication and is updated daily on week days.
Initial download of the metrics may take a while.