Fig. 1
Download original image
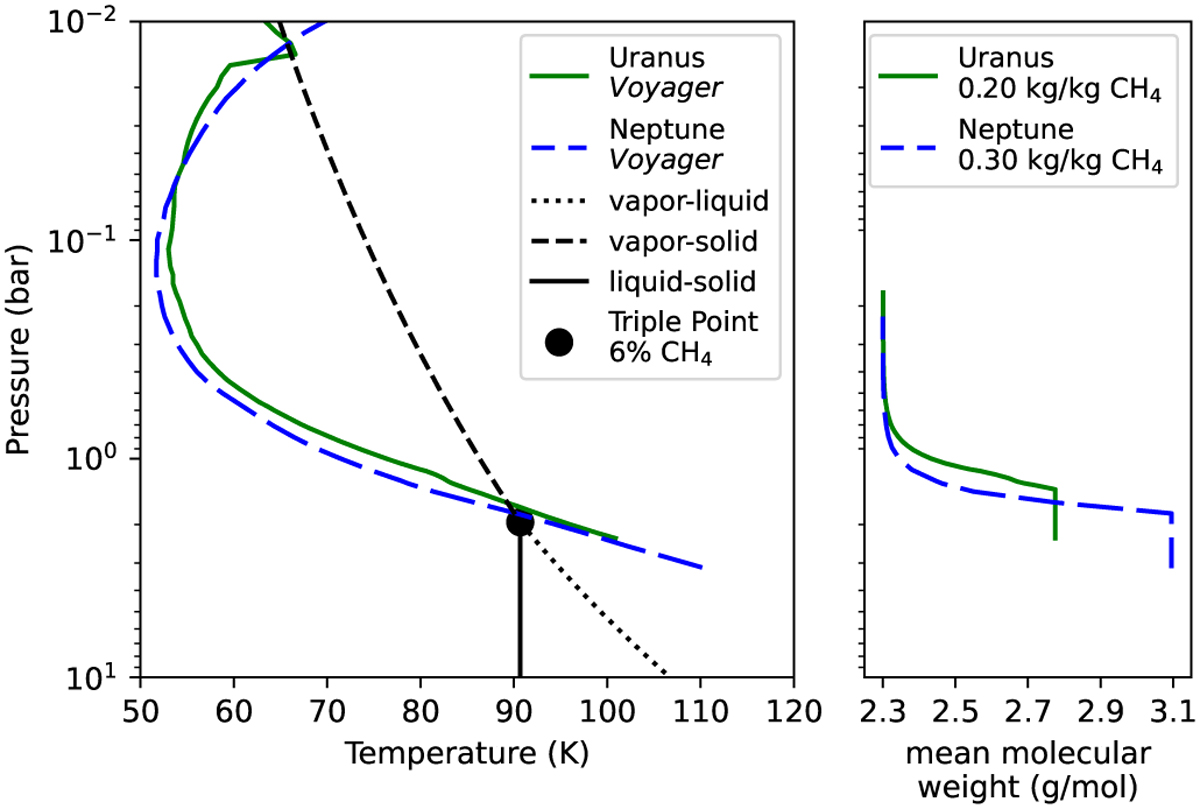
Temperature profiles and variability of mean molecular weight in ice giants. Left panel: Uranus and Neptune temperature profiles from the Voyager 2 spacecraft, retrieved from radio occultations by Lindal et al. (1987, 1990); Lindal (1992). Saturation vapor pressure and triple point are indicated for 6% of CH4 (the maximum observed value), which corresponds to a specific concentration of 0.30 kg/kg. Theoretically, methane only exists in a solid or gas form, and can only sublimate and condense. A lower methane concentration would shift the gas/iquid/solid transition curves toward the bottom of the plot. Right panel: Mean molecular weight variability in ice giants. We consider a mix of [85% H2 + 15% He] for the background atmosphere composition corresponding to a 2.3 g mol−1 mean molecular weight. We assume that CH4 specific concentration follows saturation and its specific concentration in the deep atmosphere is set to 0.20 kg/kg for Uranus (equivalent to a 3.6% volume mixing ratio) and 0.30 kg/kg for Neptune (6.2% volume mixing ratio).
Current usage metrics show cumulative count of Article Views (full-text article views including HTML views, PDF and ePub downloads, according to the available data) and Abstracts Views on Vision4Press platform.
Data correspond to usage on the plateform after 2015. The current usage metrics is available 48-96 hours after online publication and is updated daily on week days.
Initial download of the metrics may take a while.