Open Access
Fig. 6.
Download original image
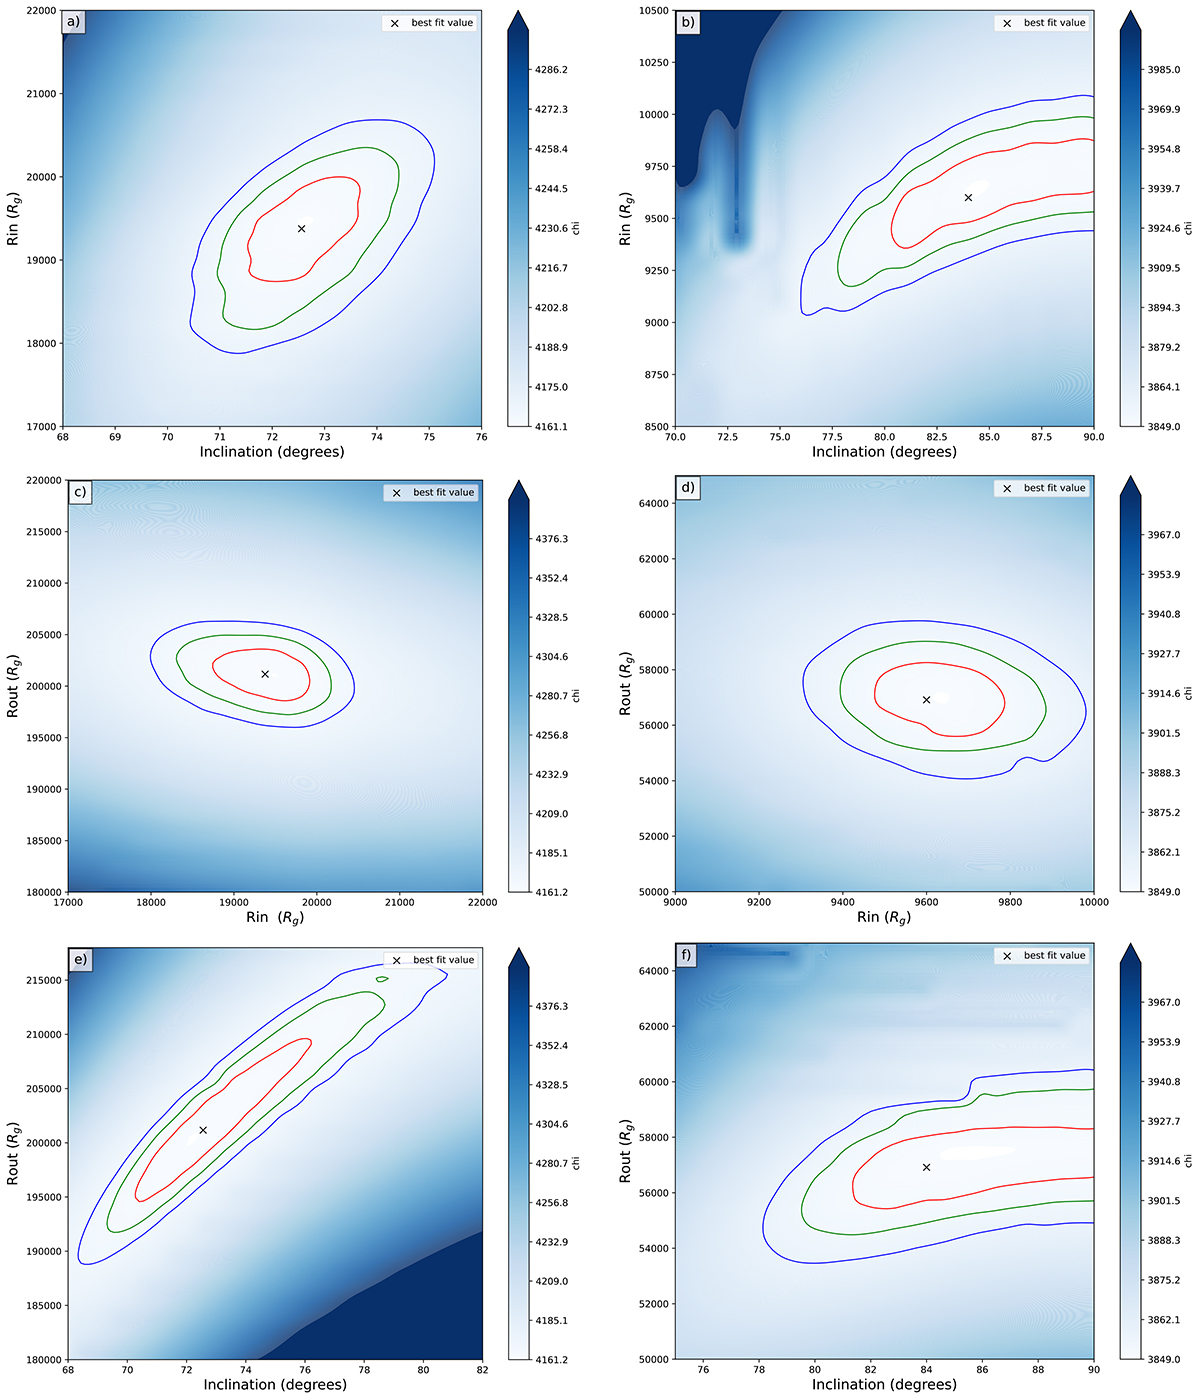
Contour plots for inclination and the outer and inner radii of the spectra related to J1357 (first column) and J1305 (second column). The contours represent the 1σ, 2σ, and 3σ confidence levels, and the cross marks the best-fit values obtained from the best fit.
Current usage metrics show cumulative count of Article Views (full-text article views including HTML views, PDF and ePub downloads, according to the available data) and Abstracts Views on Vision4Press platform.
Data correspond to usage on the plateform after 2015. The current usage metrics is available 48-96 hours after online publication and is updated daily on week days.
Initial download of the metrics may take a while.