Fig. 2.
Download original image
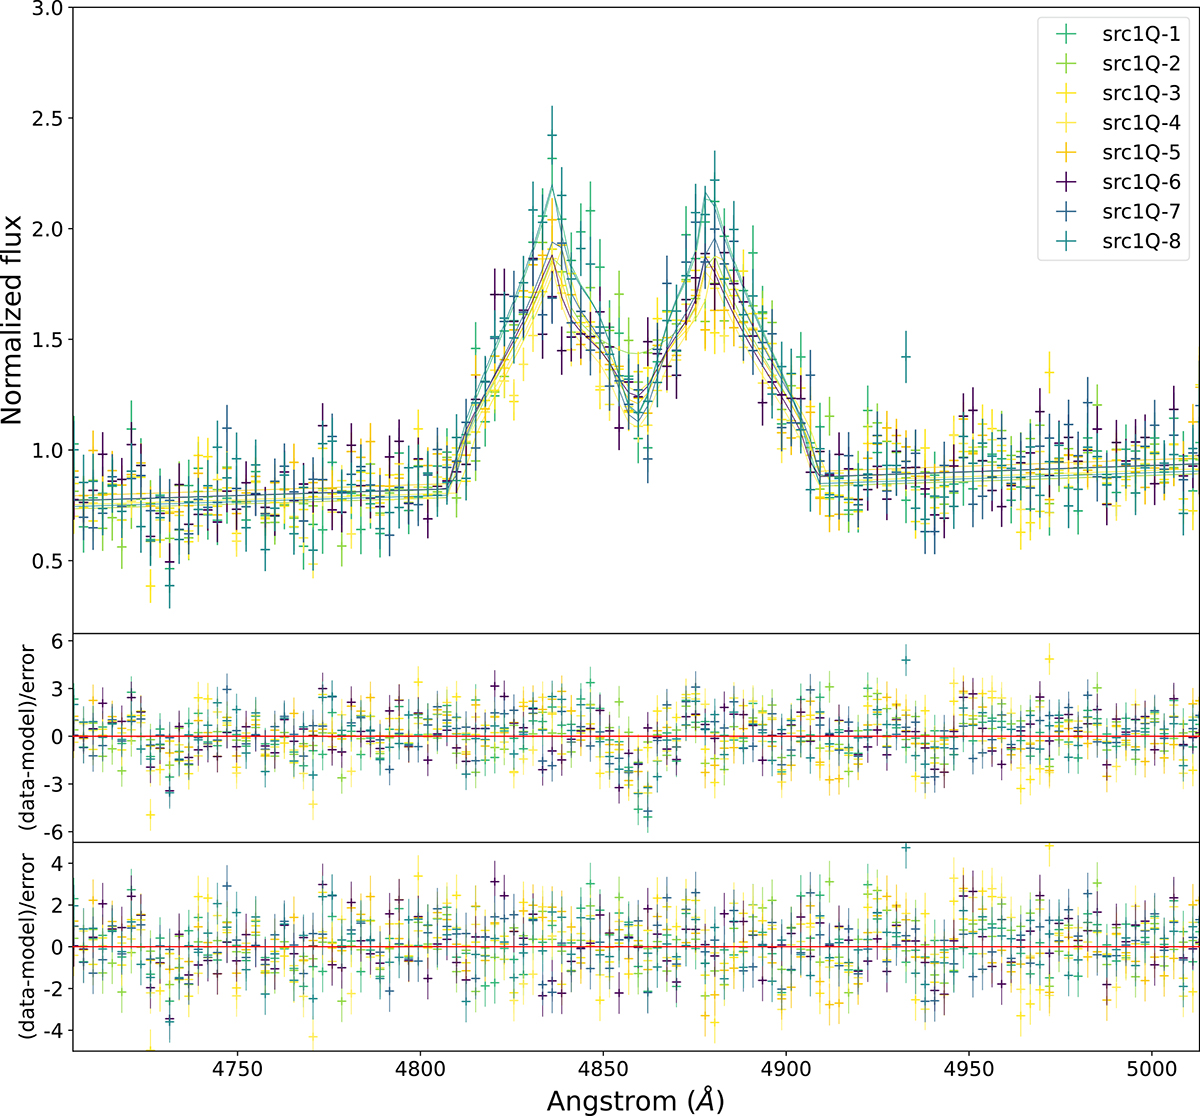
J1357 spectra collected during a quiescent phase and residuals in units of sigma with respect to the DISKLINE model described in the test (top panel). The middle and bottom panel shows the residuals obtained by using only the DISKLINE model (MODEL 1) and those obtained with the same model plus a Gaussian absorption line (MODEL 2), respectively.
Current usage metrics show cumulative count of Article Views (full-text article views including HTML views, PDF and ePub downloads, according to the available data) and Abstracts Views on Vision4Press platform.
Data correspond to usage on the plateform after 2015. The current usage metrics is available 48-96 hours after online publication and is updated daily on week days.
Initial download of the metrics may take a while.