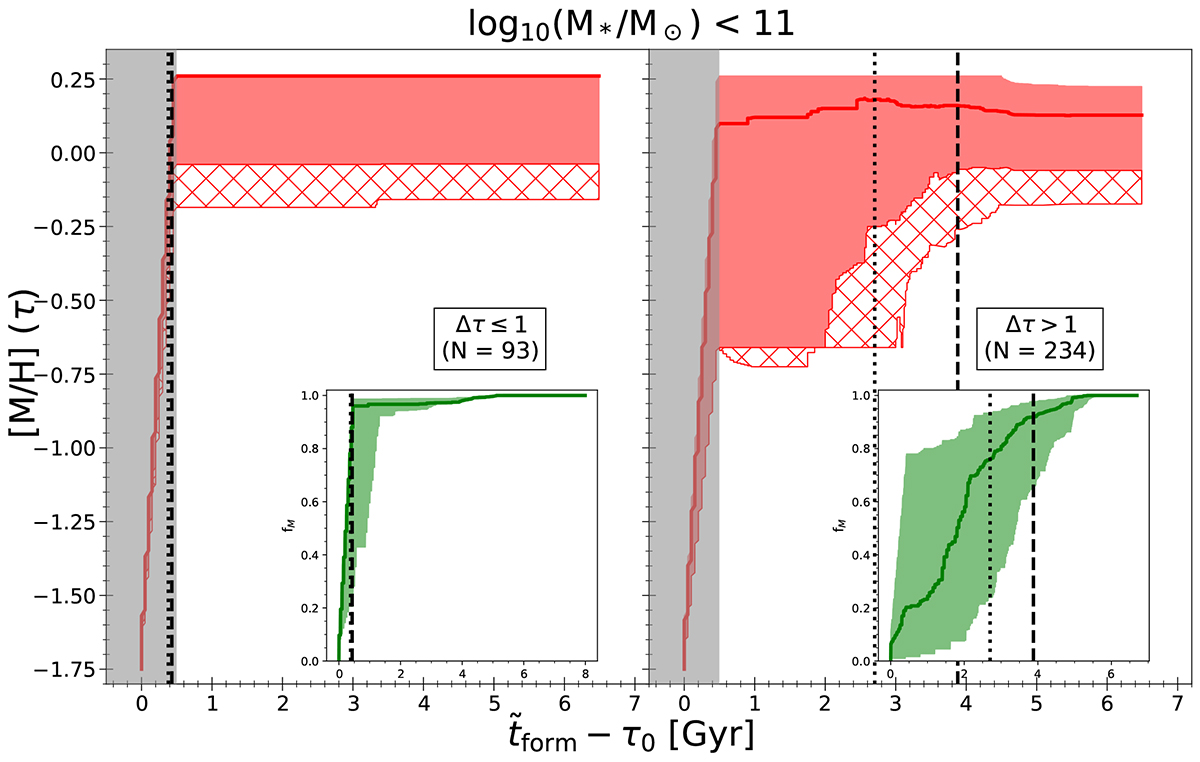
Fig. 7.

Download original image
MEHs and SFHs of all galaxies with log10(M*/M⊙) < 11 together, divided according to their SFH, between galaxies that formed within Δτ = τ95 − τ5 = lower and greater than 1 Gyr. Since we are considering galaxies at all redshifts, given the mass completeness limit, the statistics are biased toward higher-mass galaxies. The hatched region indicates the 16th percentile of galaxies in the lowest mass bin, 10.4 ≤ log10(M*/M⊙) < 10.6.
Current usage metrics show cumulative count of Article Views (full-text article views including HTML views, PDF and ePub downloads, according to the available data) and Abstracts Views on Vision4Press platform.
Data correspond to usage on the plateform after 2015. The current usage metrics is available 48-96 hours after online publication and is updated daily on week days.
Initial download of the metrics may take a while.


