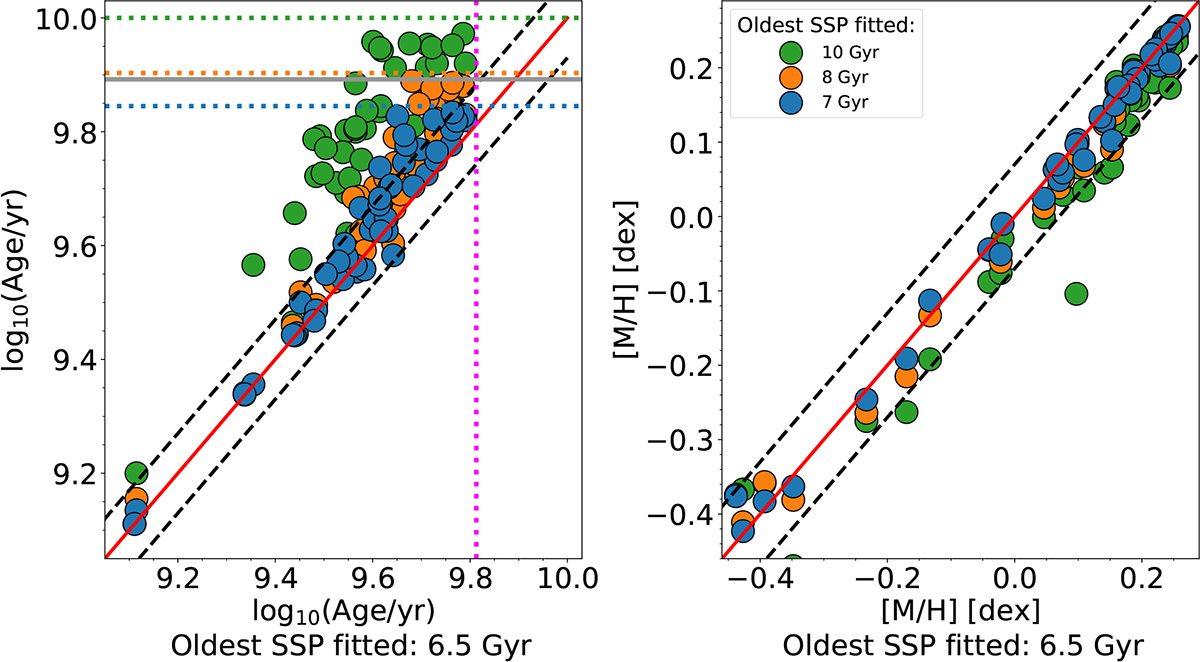
Fig. A.1.

Download original image
Comparison between estimated ages (left panel) and metallicities (right panel) using different upper limits on the age of the input SSPs. Blue, orange, and green dots represents the estimated ages using a 7, 8, and 10 Gyr age limit, respectively, marked in the left panel by the corresponding horizontal dotted lines. The magenta vertical line corresponds to the 6.5 Gyr age limit imposed in section 3. The gray horizontal line is the age of the Universe at z = 0.6 (≈7.8 Gyr). On both panels, the red line is the one-to-one relation, while the black dashed lines are the 1σAge and 1σ[M/H] uncertainties.
Current usage metrics show cumulative count of Article Views (full-text article views including HTML views, PDF and ePub downloads, according to the available data) and Abstracts Views on Vision4Press platform.
Data correspond to usage on the plateform after 2015. The current usage metrics is available 48-96 hours after online publication and is updated daily on week days.
Initial download of the metrics may take a while.


