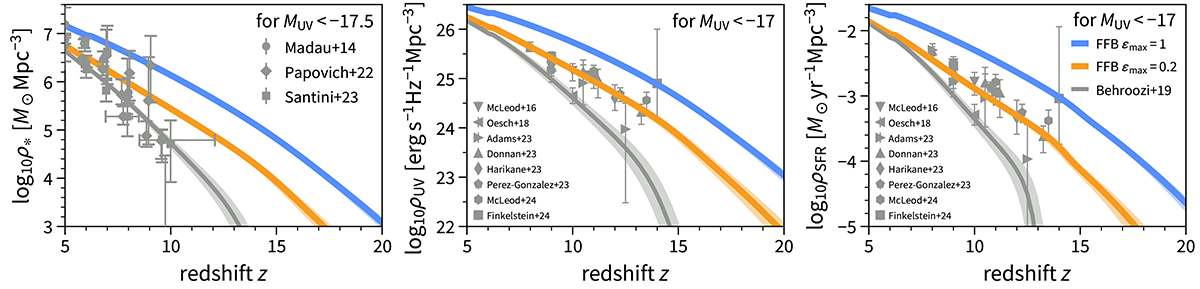
Fig. 8.
Download original image
Cosmological evolution of comoving densities. Left: Stellar mass. Middle: UV luminosity. Right: SFR. The densities are computed based on galaxies brighter than MUV = −17.5 or −17 as indicated in the labels. Shown are the FFB predictions for the bounding values of ϵmax = 0.2 and 1 (orange and blue respectively). Shown in comparison is the standard UM model (B19, gray). The shaded bands represent rough uncertainty estimates that correspond to varying the magnitude limits by 0.5 mag up or down. The FFB predictions are well above the UM model, starting with a small excess at z ∼ 8 and growing to an order of magnitude at z ∼ 12. Shown for tentative comparison are observational data (symbols). The FFB model seems to match the tentative data for UV and SFR density with ϵmax ∼ 0.2. The references include measurements of stellar density (Madau & Dickinson 2014; Papovich et al. 2023; Santini et al. 2023), UV density, and SFR density estimated from UV (McLeod et al. 2016; Oesch et al. 2018; Adams et al. 2023; Donnan et al. 2023; Harikane et al. 2023a; Pérez-González et al. 2023; McLeod et al. 2024; Finkelstein et al. 2023a; see also e.g., Coe et al. 2013; Ellis et al. 2013; Bouwens et al. 2020, 2023b,a; Robertson et al. 2023a).
Current usage metrics show cumulative count of Article Views (full-text article views including HTML views, PDF and ePub downloads, according to the available data) and Abstracts Views on Vision4Press platform.
Data correspond to usage on the plateform after 2015. The current usage metrics is available 48-96 hours after online publication and is updated daily on week days.
Initial download of the metrics may take a while.