Fig. 6.
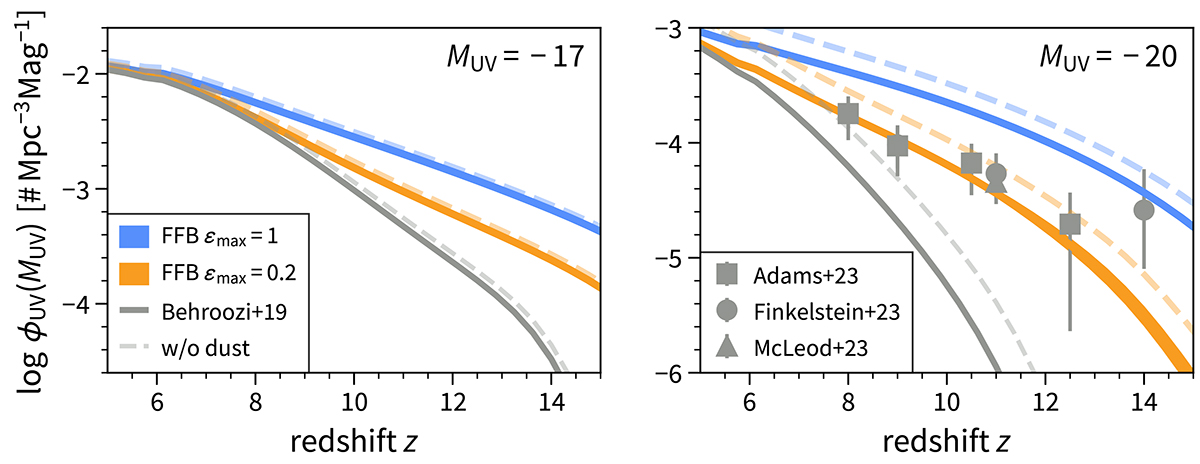
Download original image
Evolution of the UV luminosity function at MUV = − 17 (left) and −20 (right). Similar to Fig. 5, the colored bands represent dust-corrected FFB predictions for ϵmax = 0.2 (orange) or 1 (blue) and the gray line shows the fiducial UM model (B19). The UVLFs uncorrected for dust are shown by dashed lines. The FFB predictions at MUV = − 20 are higher than the UM model starting at z ∼ 7 and more so at higher redshifts. The open gray data points in the right panel are JWST measurements (Adams et al. 2024; Finkelstein et al. 2023a; McLeod et al. 2024). The tentative comparison indicates a fit with ϵmax ∼ 0.2 at z = 8 − 12 and possibly higher efficiencies at higher redshifts.
Current usage metrics show cumulative count of Article Views (full-text article views including HTML views, PDF and ePub downloads, according to the available data) and Abstracts Views on Vision4Press platform.
Data correspond to usage on the plateform after 2015. The current usage metrics is available 48-96 hours after online publication and is updated daily on week days.
Initial download of the metrics may take a while.