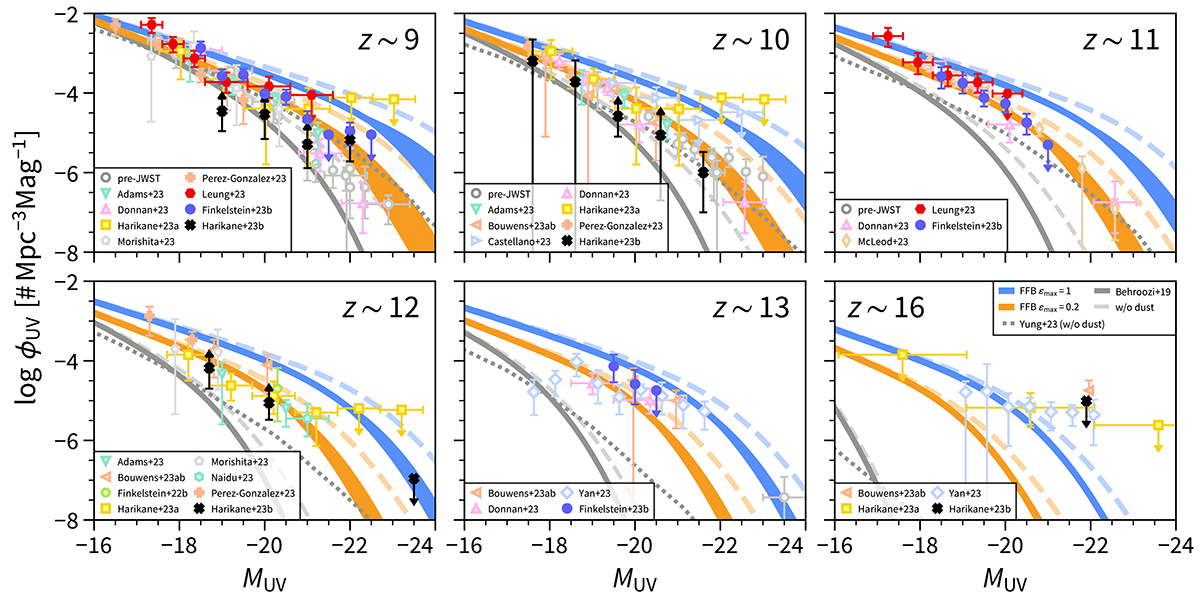
Fig. 5.
Download original image
Luminosity function. Shown are the FFB predictions for the rest-frame UVLFs of galaxies at z = 9–13 and 16. The colored bands represent dust-corrected FFB predictions for ϵmax = 0.2 (orange) or 1 (blue). The dust correction assumes either the shell or the disk version of the FFB model at the bottom or top bounds of the shaded area, respectively. The UVLFs uncorrected for dust are shown by dashed lines. Shown for comparison is the fiducial UM model (B19) (gray), corrected for dust (solid) or uncorrected (dashed). Also shown is the fiducial SAM simulation without dust attenuation (Yung et al. 2024a, dotted gray). The FFB predictions are well above the standard models, e.g., at z ∼ 9 for MUV ≥ − 19 and at z ∼ 12 for MUV ≥ − 18. The open gray data points are pre-JWST constraints (McLeod et al. 2016; Oesch et al. 2018; Morishita et al. 2018; Stefanon et al. 2019; Bowler et al. 2020; Bouwens et al. 2021; Harikane et al. 2022; Finkelstein et al. 2022a; only for z ≲ 10). The colored open symbols are measurements based on galaxies photometrically selected with JWST (Adams et al. 2024; Bouwens et al. 2023a,b; Castellano et al. 2022; Donnan et al. 2023; Finkelstein et al. 2022b; Harikane et al. 2023a; McLeod et al. 2024; Morishita & Stiavelli 2023; Naidu et al. 2022; Pérez-González et al. 2023; Yan et al. 2023; partly complied by Shen et al. 2023). In particular, bright-filled symbols are based on the JWST NGDEEP Epoch 1 (Leung et al. 2023, red), the complete CEERS sample (Finkelstein et al. 2023a, blue), and the JWST spectroscopically confirmed galaxies (Harikane et al. 2024, black). At z ∼ 11, the FFB predictions seem to match the tentative bright-end JWST observations with ϵmax ∼ 0.2 − 0.5. We note that the photometric constraints at z ∼ 16 are highly uncertain and possibly subject to redshift interlopers (Harikane et al. 2024).
Current usage metrics show cumulative count of Article Views (full-text article views including HTML views, PDF and ePub downloads, according to the available data) and Abstracts Views on Vision4Press platform.
Data correspond to usage on the plateform after 2015. The current usage metrics is available 48-96 hours after online publication and is updated daily on week days.
Initial download of the metrics may take a while.