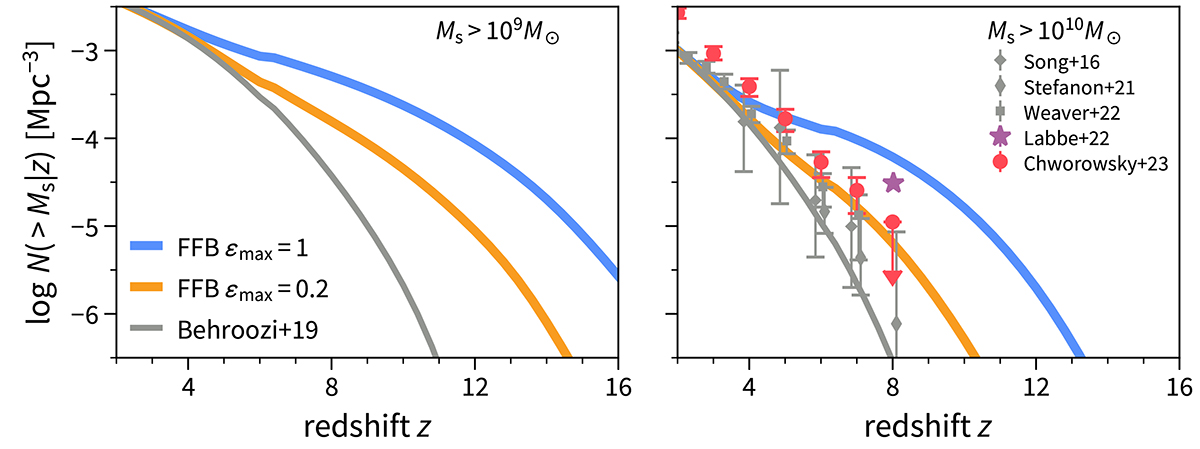
Fig. 4.
Download original image
Distribution of stellar masses. Shown are the FFB predictions for the number density of galaxies with stellar masses above 109 M⊙ (left panel) or 1010 M⊙ (right panel). The blue and orange lines refer to ϵmax = 1 and 0.2, respectively. The standard UM model (B19) is shown for comparison (gray line). The FFB predictions are above the UM model for z ≥ 6, and more so at higher redshifts. Shown for tentative comparison are the observational measurements compiled by Chworowsky et al. (2023), including JWST data (Labbé et al. 2023; Chworowsky et al. 2023) as well as earlier HST data (Song et al. 2016; Stefanon et al. 2021; Weaver et al. 2023). The JWST measurements are systematically higher than the previous measurements and they are above the standard UM model. The observations seem to favor the FFB prediction with ϵmax ≳ 0.2.
Current usage metrics show cumulative count of Article Views (full-text article views including HTML views, PDF and ePub downloads, according to the available data) and Abstracts Views on Vision4Press platform.
Data correspond to usage on the plateform after 2015. The current usage metrics is available 48-96 hours after online publication and is updated daily on week days.
Initial download of the metrics may take a while.