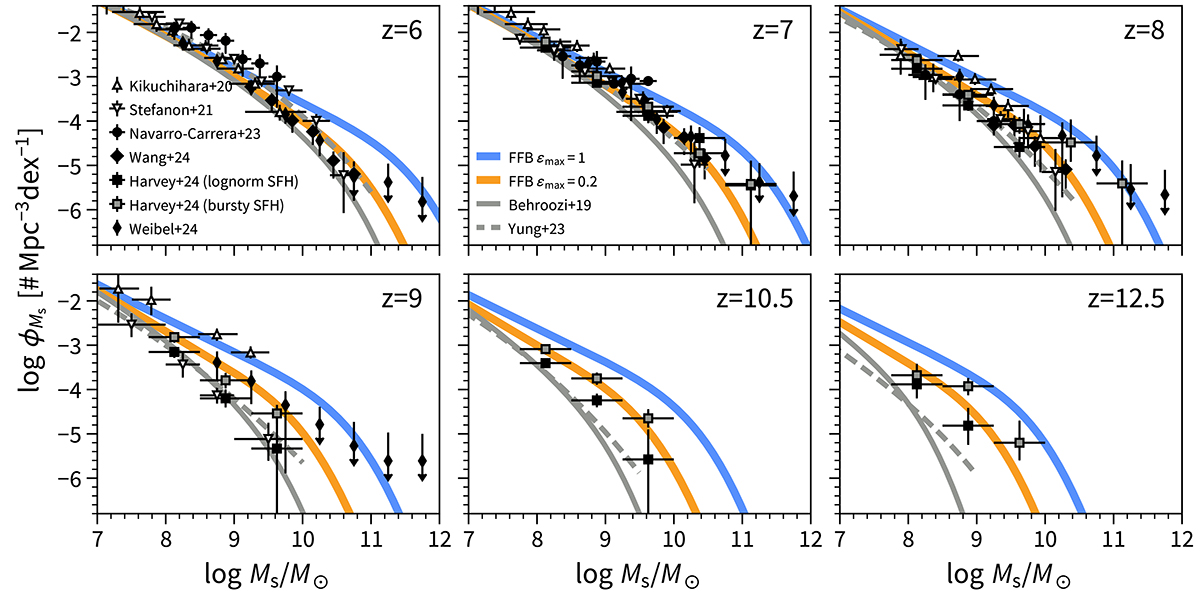
Fig. 3.
Download original image
Stellar mass function. Shown are the predictions of the FFB model at z = 6–9, 12.5, and 16. The blue and orange lines refer to ϵmax = 1 and 0.2, respectively. Shown for comparison are the extrapolated standard UM model (B19, solid gray line) and the results of a standard semi-analytic model (Yung et al. 2024a, solid dashed line). The FFB model predicts a greater abundance of massive galaxies, particularly evident from Ms ≳ 109 M⊙ at z ∼ 9. The excess for lower masses also becomes larger at higher z. The open symbols show pre-JWST observational constraints (Kikuchihara et al. 2020; Stefanon et al. 2021) and the filled symbols refer to tentative JWST constraints (Navarro-Carrera et al. 2024; Wang et al. 2024; Harvey et al. 2024; Weibel et al. 2024). The FFB predictions with ϵmax ∼ 0.2 seem to be consistent with the observed mass function at the massive end, though the evidence for deviations of the data from the standard UM model is only marginal for this statistic, especially at z ∼ 9. This is compared to the stronger evidence provided below by other observables. Indeed, we should note that SMF measurements suffer from large uncertainties in both observation and modeling. For example, assuming a bursty SFH (as expected by the FFB scenario, Sect. 4) rather than a smooth SFH during SED fitting results in an increased abundance of massive galaxies (gray squares; Harvey et al. 2024).
Current usage metrics show cumulative count of Article Views (full-text article views including HTML views, PDF and ePub downloads, according to the available data) and Abstracts Views on Vision4Press platform.
Data correspond to usage on the plateform after 2015. The current usage metrics is available 48-96 hours after online publication and is updated daily on week days.
Initial download of the metrics may take a while.