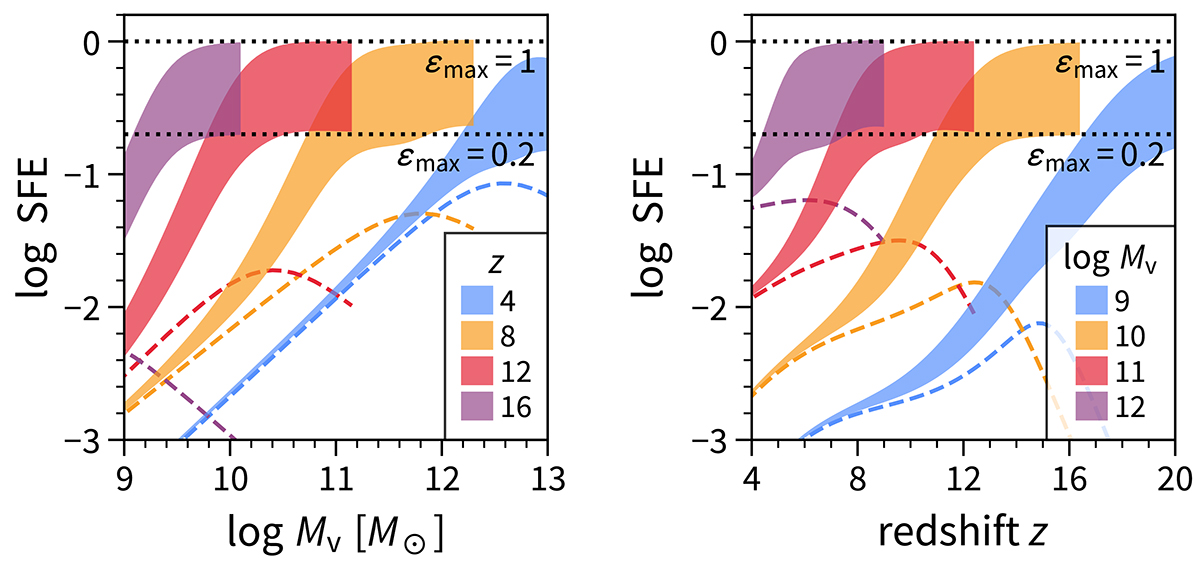
Fig. 2.
Download original image
Star formation efficiency adopted for the FFB model, as in Fig. 1, but via curves of SFE versus Mv for a given z (left) and SFE versus z for a given Mv (right). The SFE is made to coincide with the standard UM model (B19) (dashed lines) at low masses and redshifts and to approach ϵmax above the FFB thresholds of mass and redshift. The shaded areas refer to a maximum SFE that ranges from ϵmax = 0.2 (bottom) to 1 (top). The FFB threshold is at roughly 0.5 ϵmax. The SFE does not reach ϵmax for Mv ≥ 1012.5 M⊙ where SFR quenching is assumed.
Current usage metrics show cumulative count of Article Views (full-text article views including HTML views, PDF and ePub downloads, according to the available data) and Abstracts Views on Vision4Press platform.
Data correspond to usage on the plateform after 2015. The current usage metrics is available 48-96 hours after online publication and is updated daily on week days.
Initial download of the metrics may take a while.