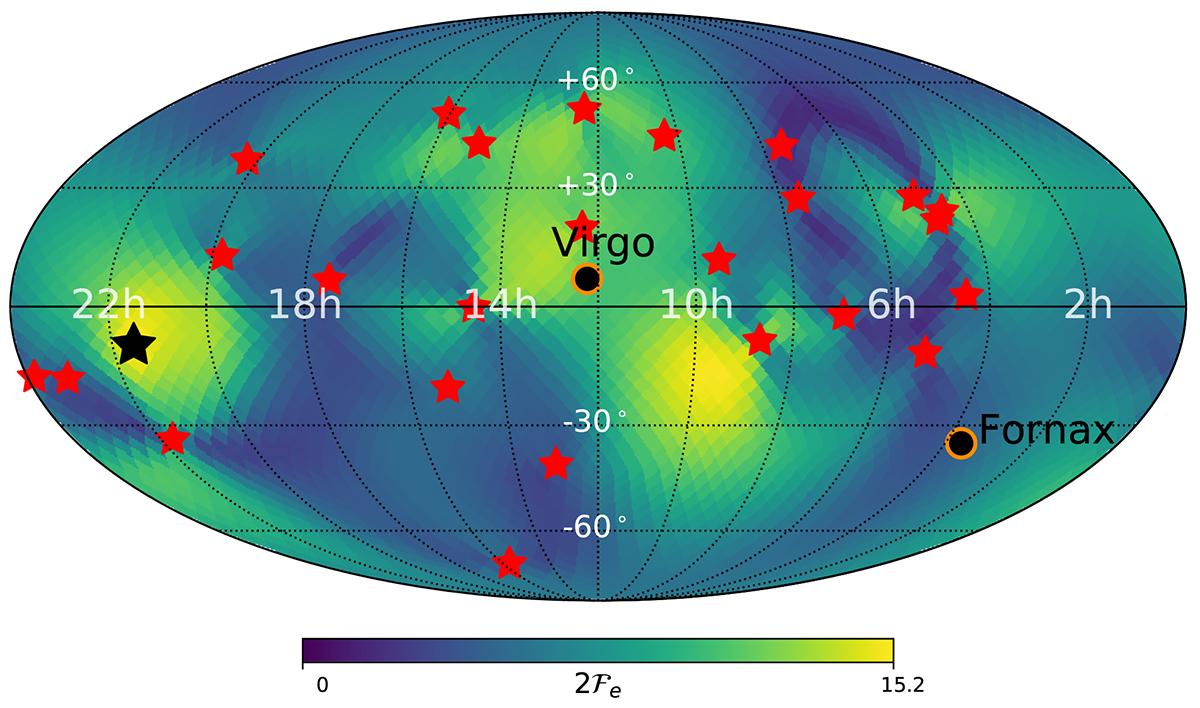
Fig. 3.

Download original image
Pulsar-shuffled version of the ℱe-statistic of the candidate source at fgw = 4.64 nHz averaged over the noise uncertainties for the custom PSRN model. The black star shows the position of highest ℱe, whereas the red stars show the positions of the pulsars. We see that the highest ℱe pixel changed position but is still significant. The Fornax and Virgo clusters are shown as black dots.
Current usage metrics show cumulative count of Article Views (full-text article views including HTML views, PDF and ePub downloads, according to the available data) and Abstracts Views on Vision4Press platform.
Data correspond to usage on the plateform after 2015. The current usage metrics is available 48-96 hours after online publication and is updated daily on week days.
Initial download of the metrics may take a while.


