Open Access
Fig. 6.
Download original image
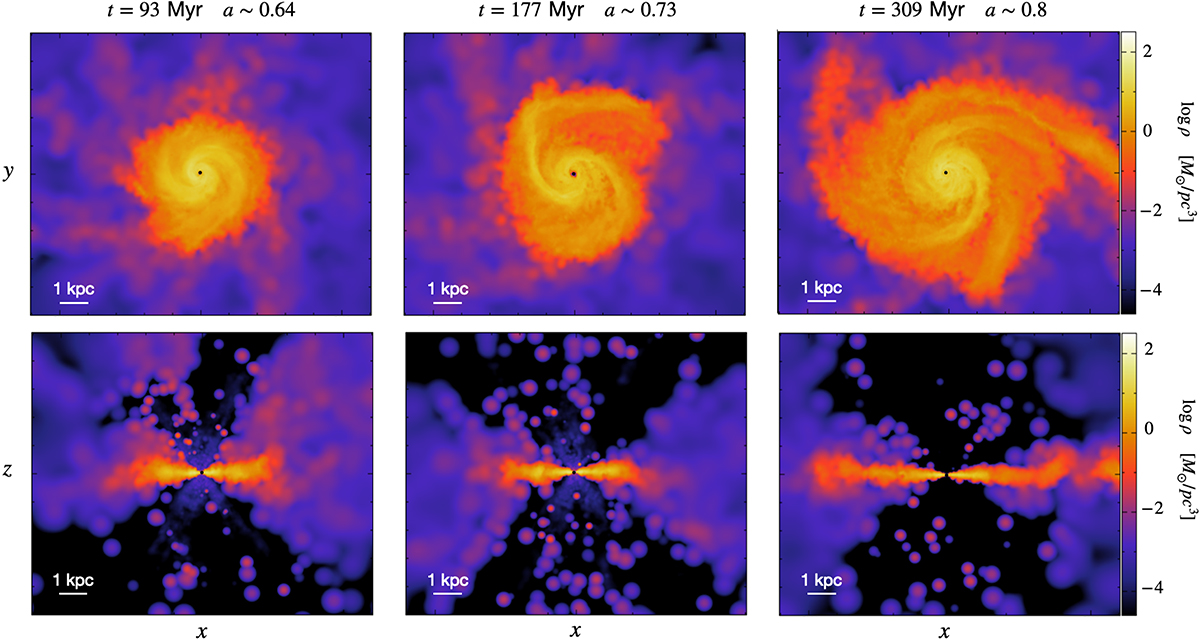
Density slices of three snapshots from simulation qcrE_f, with the disk face-on in the top panels and side-on in the bottom panels. The MBH location is marked by a black dot.
Current usage metrics show cumulative count of Article Views (full-text article views including HTML views, PDF and ePub downloads, according to the available data) and Abstracts Views on Vision4Press platform.
Data correspond to usage on the plateform after 2015. The current usage metrics is available 48-96 hours after online publication and is updated daily on week days.
Initial download of the metrics may take a while.