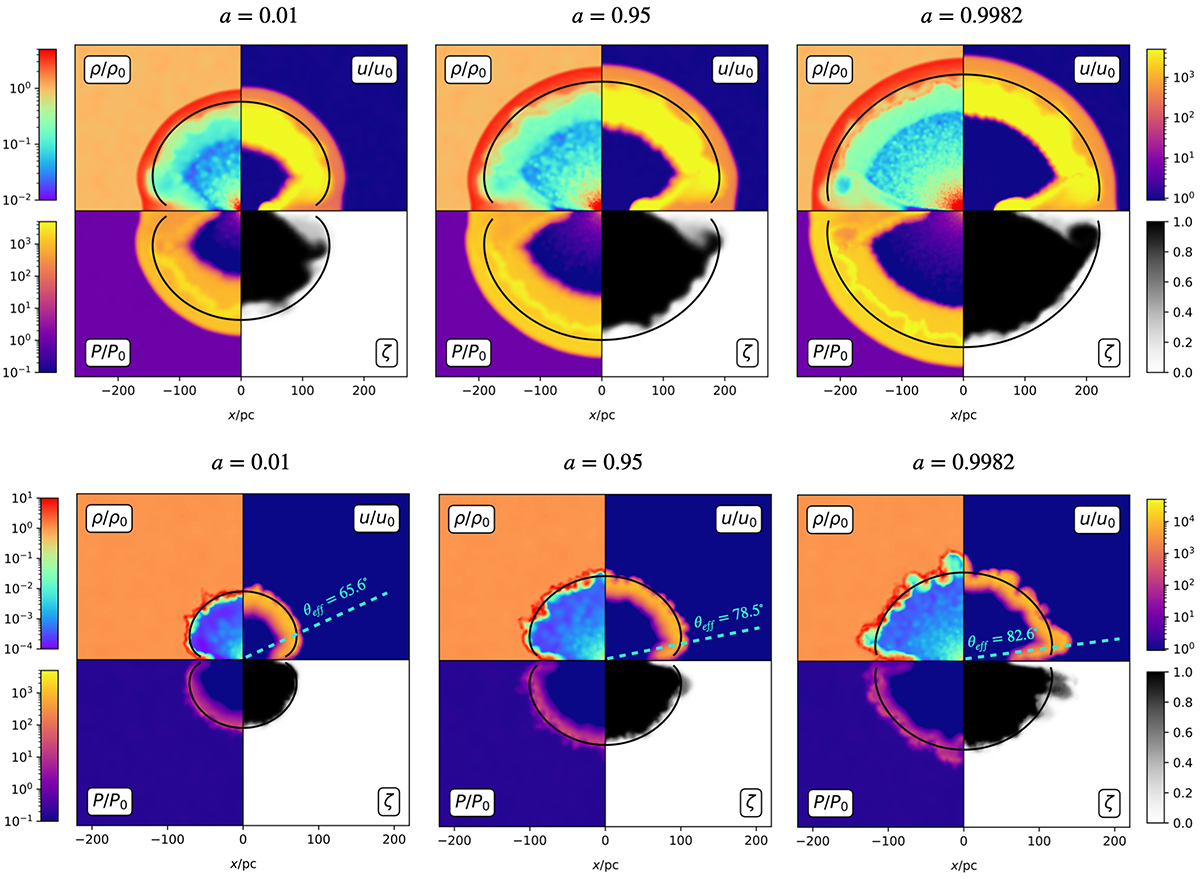
Fig. 4.
Download original image
Final snapshots of the propagation of an AGN wind-driven outflow for different spin values (increasing from left to right) and the two considered regimes (energy-driven in the top row and momentum-driven in the bottom one). Each panel illustrates the density, temperature, and pressure fields in units of the corresponding quantities of the assumed background medium as well as the wind mass fraction. In the energy-driven simulations, the outflow can be divided into four distinct sections: (1) the freely expanding wind, (2) the shocked wind, (3) the shocked ambient medium, and (4) the undisturbed ambient medium. In the momentum-driven simulations, radiative cooling makes the shocked wind layer cool and regions (2) and (3) are condensed into a thin shell. The wind tracer is injected together with the wind and is therefore only present in regions (1) and (2). The black lines correspond to the analytical location of the contact discontinuity between regions (2) and (3), as computed in Eqs. (11)–(13). In momentum-driven simulations, the cyan dashed lines indicate the effective aperture of the radiation as defined in Sect. 2.1.
Current usage metrics show cumulative count of Article Views (full-text article views including HTML views, PDF and ePub downloads, according to the available data) and Abstracts Views on Vision4Press platform.
Data correspond to usage on the plateform after 2015. The current usage metrics is available 48-96 hours after online publication and is updated daily on week days.
Initial download of the metrics may take a while.