Open Access
Fig. A.2.
Download original image
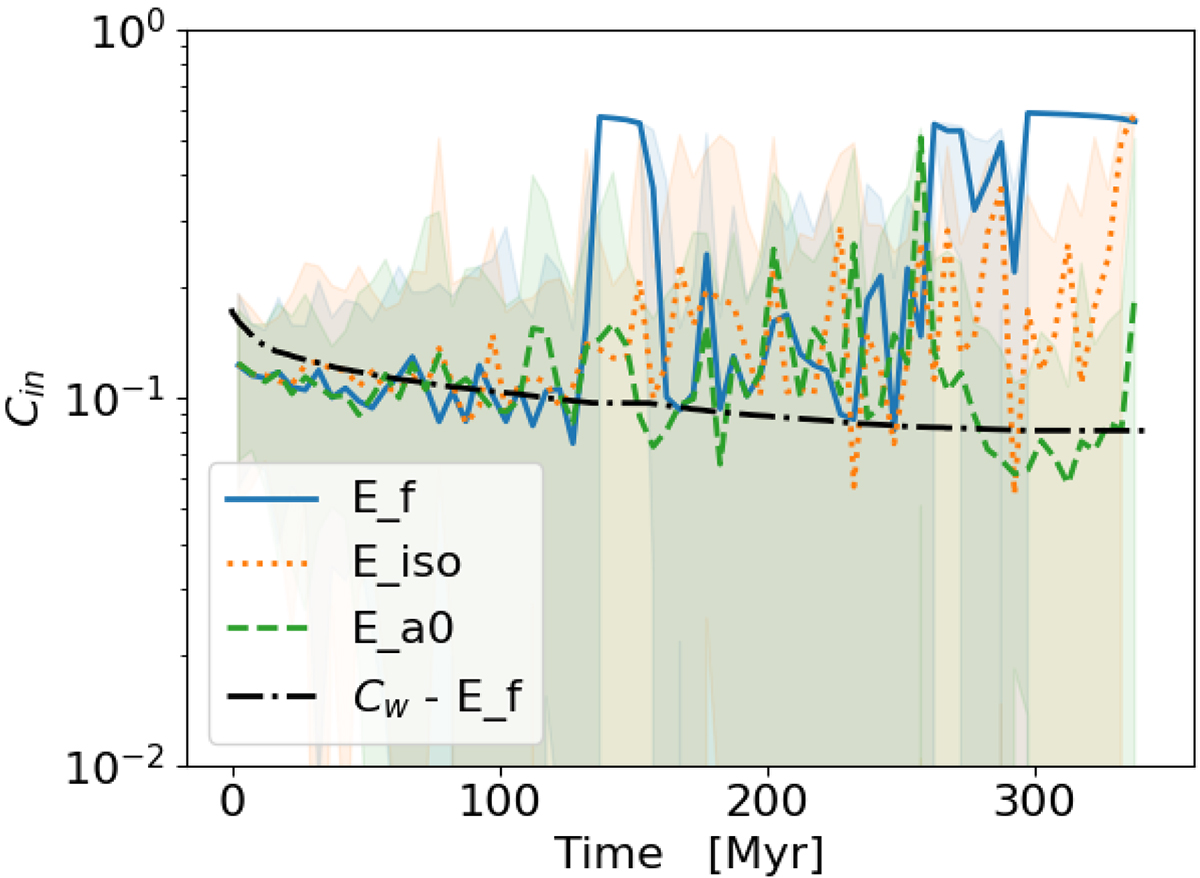
Coefficients Cin in qcrE simulations. The lines correspond to the median values over time bins of 5 Myr, while the shaded regions span from the 16th to the 84th percentiles over these bins. The coefficient Cw is also shown for the qcrE_f run.
Current usage metrics show cumulative count of Article Views (full-text article views including HTML views, PDF and ePub downloads, according to the available data) and Abstracts Views on Vision4Press platform.
Data correspond to usage on the plateform after 2015. The current usage metrics is available 48-96 hours after online publication and is updated daily on week days.
Initial download of the metrics may take a while.