Open Access
Fig. 11.
Download original image
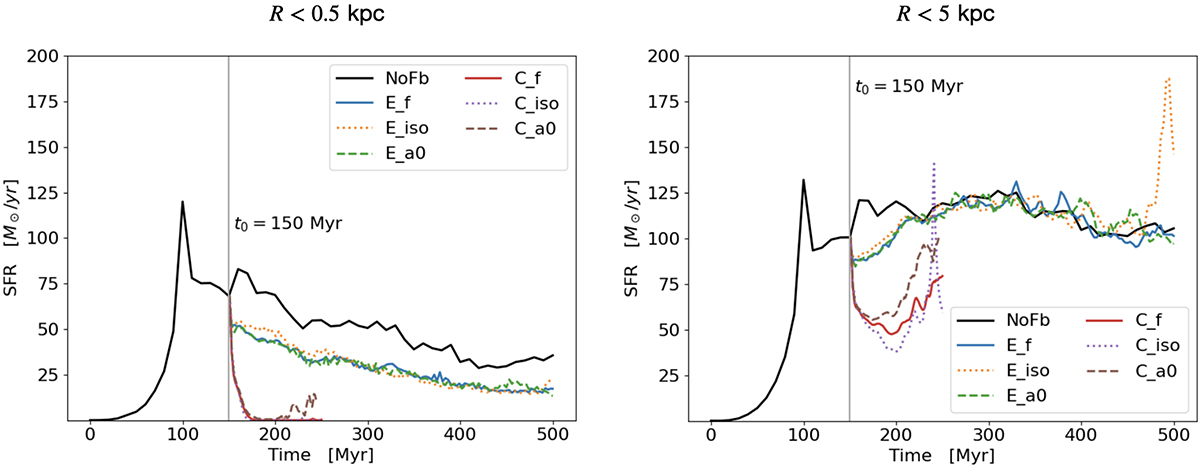
Star formation rate in the nuclear region (left) and at galactic scale (right) for qcrE, qcrC, and qcrNoFb simulations. Here, t = 0 corresponds to the initial condition with the spinning gaseous halo in hydrostatic equilibrium and t0 = 150 Myr (when AGN feedback is turned on) is marked with a gray vertical line.
Current usage metrics show cumulative count of Article Views (full-text article views including HTML views, PDF and ePub downloads, according to the available data) and Abstracts Views on Vision4Press platform.
Data correspond to usage on the plateform after 2015. The current usage metrics is available 48-96 hours after online publication and is updated daily on week days.
Initial download of the metrics may take a while.