Fig. B.1.
Download original image
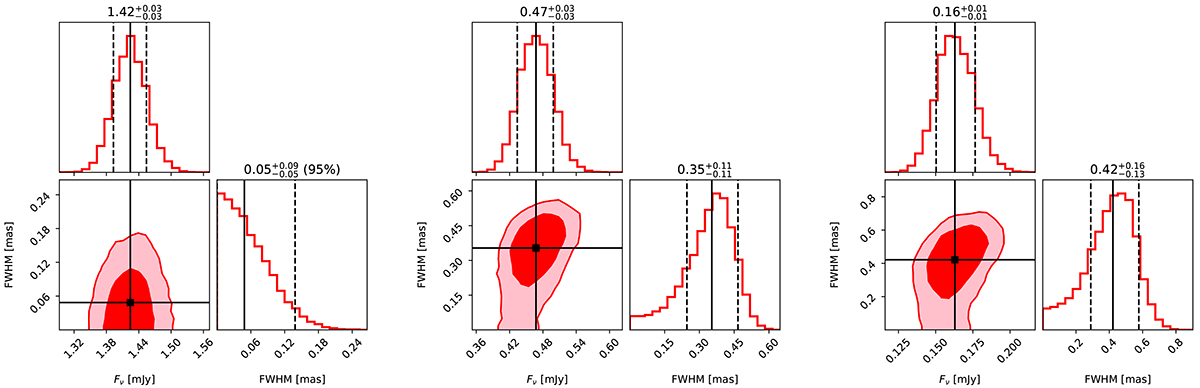
Posterior probability distribution on the source size and flux density in our EVN 4.9 GHz epochs at T − T0 = 43 (RG1013 C, left), 117 (RG013 D, centre) and 261 (RG013 F, right) days. In each corner plot, the top-left and bottom-right sub-panels show histograms of the posterior samples of Fν and FWHM, with the vertical solid lines showing the median and the vertical dashed lines bracketing the 68% credible interval or, if the latter extends to 0, the 95% credible upper limit. The bottom-left sub-panel of each corner plot shows the smallest contours containing 68% and 95% of the posterior probability.
Current usage metrics show cumulative count of Article Views (full-text article views including HTML views, PDF and ePub downloads, according to the available data) and Abstracts Views on Vision4Press platform.
Data correspond to usage on the plateform after 2015. The current usage metrics is available 48-96 hours after online publication and is updated daily on week days.
Initial download of the metrics may take a while.