Fig. 7.
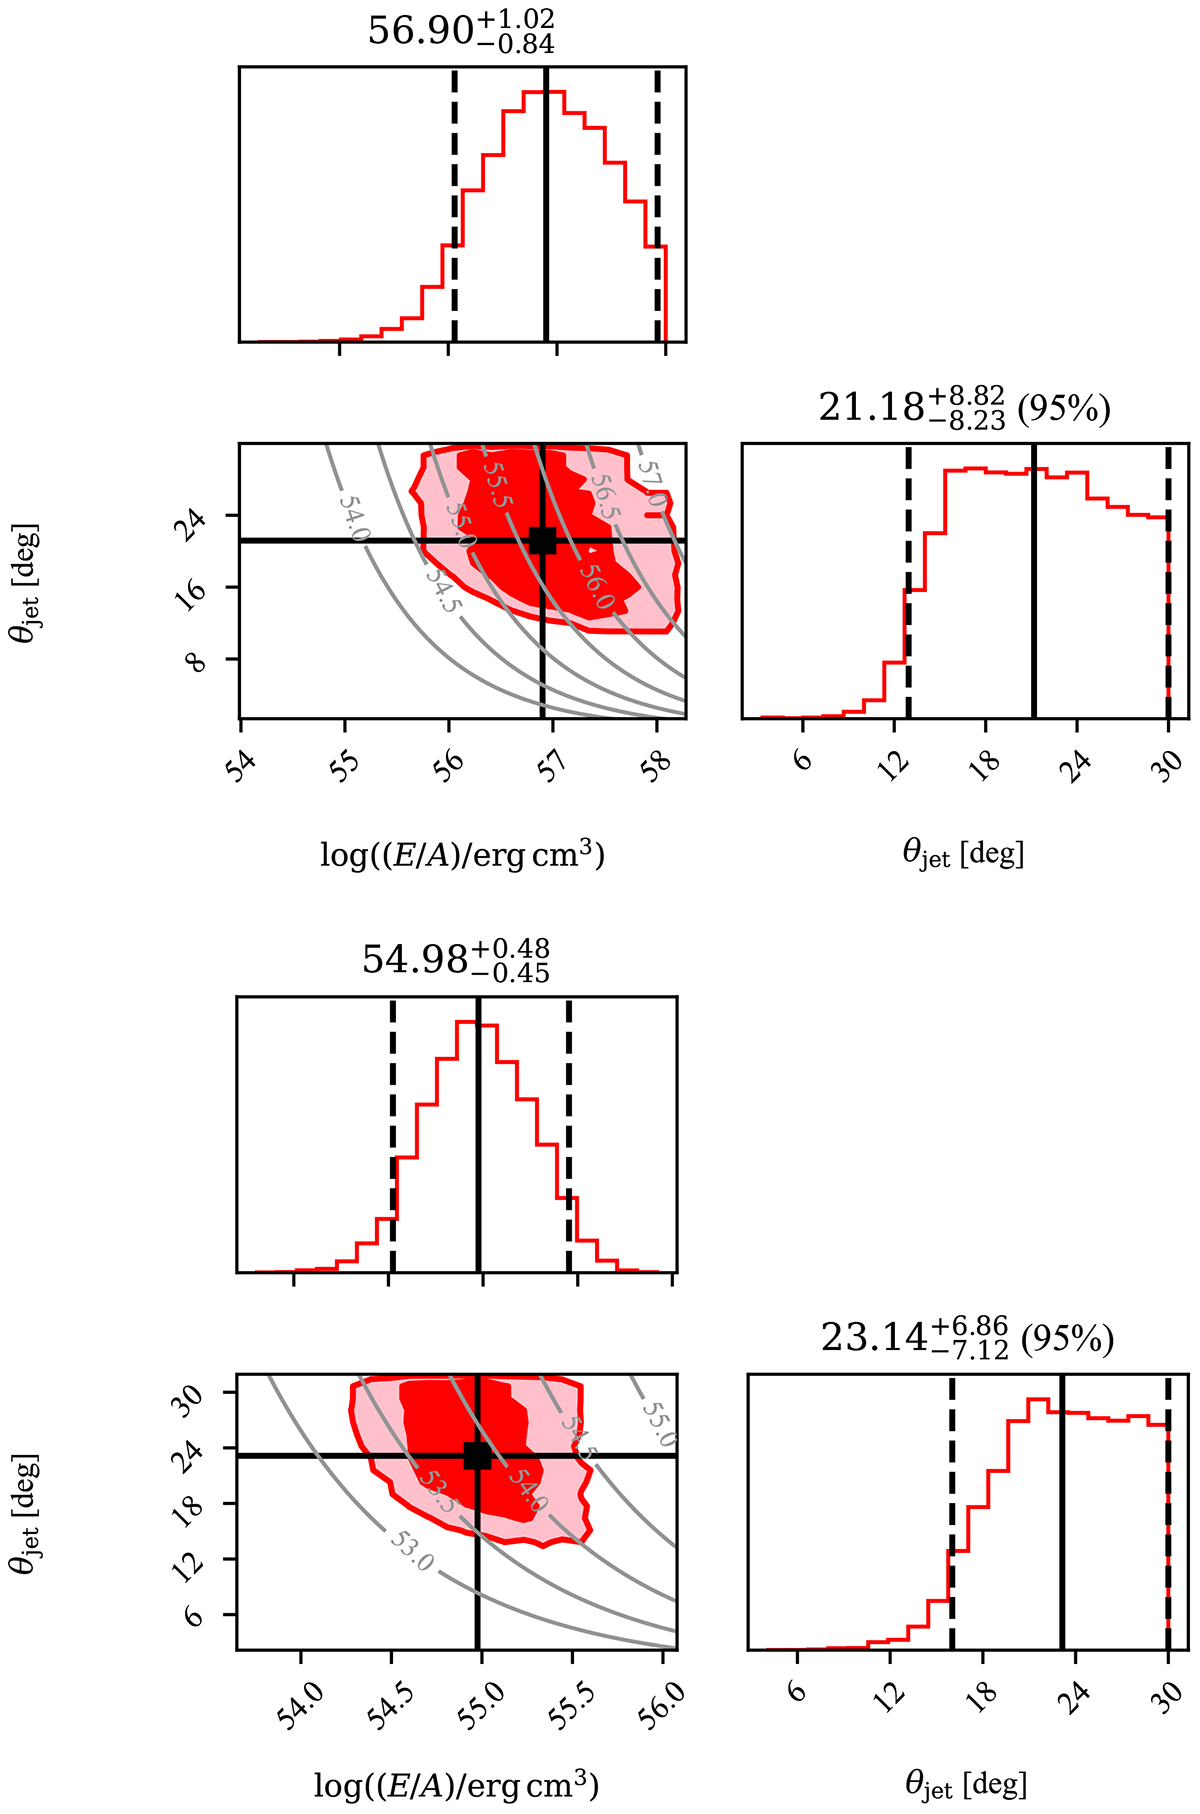
Download original image
Corner plot of the posterior probability density of the physical model parameters in the homogeneous (top panel) or wind-like (bottom panel) external medium case and assuming the FS to dominate at 15 GHz and the RS to dominate at 4.9–8.3 GHz. In each panel, the red histograms show the marginalised posterior probability densities, with black solid vertical lines showing the median and dashed lines showing the 68% credible interval or, if the latter extends to the lower (upper) extremum of the prior range, the 95% upper (lower) limit (values reported on top of the panels). The filled contours show the smallest regions containing 68% and 95% of the two-dimensional posterior probability, with the black squares showing the position of the median. The grey lines show contours of constant total jet energy assuming A = 1 cm−3. Each contour is labeled with the base-10 logarithm of the corresponding total jet energy.
Current usage metrics show cumulative count of Article Views (full-text article views including HTML views, PDF and ePub downloads, according to the available data) and Abstracts Views on Vision4Press platform.
Data correspond to usage on the plateform after 2015. The current usage metrics is available 48-96 hours after online publication and is updated daily on week days.
Initial download of the metrics may take a while.