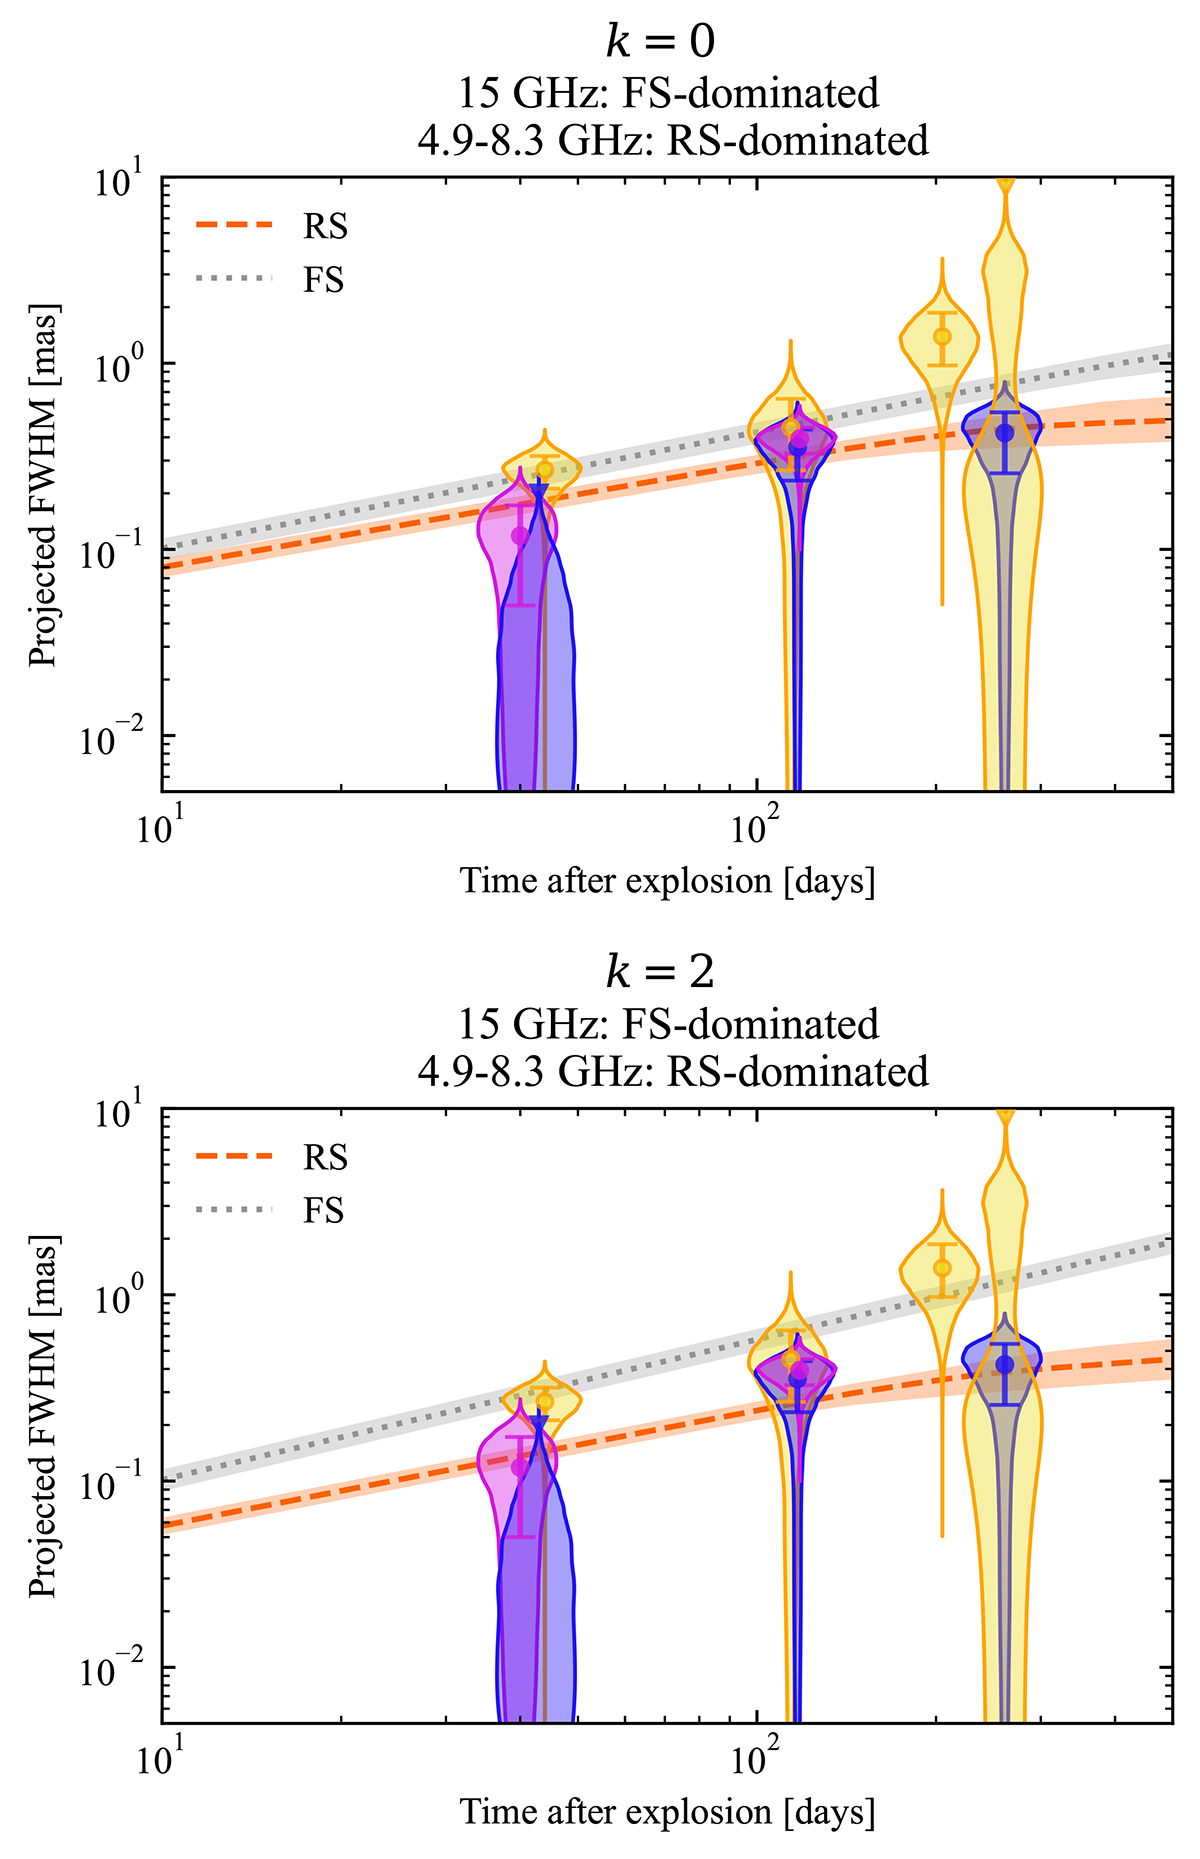
Fig. 6.
Download original image
Model size evolution in a FS plus RS scenario. The violins and the error bars show the source size evolution as inferred by our observations, in the same way as in Figure 1. The gray dotted line and orange dashed lines show the medians of the posterior predictive distributions of the FS and RS size, respectively, as obtained by fitting the physical model described in Appendix D to the sizes shown in the figure, assuming a homogeneous (top panel) or wind-like (bottom panel) external medium, and assuming the FS to dominate at 15 GHz and the RS to dominate at 4.9 and 8.3 GHz. The shaded bands around these lines show the 68% credible interval of the posterior predictive distribution.
Current usage metrics show cumulative count of Article Views (full-text article views including HTML views, PDF and ePub downloads, according to the available data) and Abstracts Views on Vision4Press platform.
Data correspond to usage on the plateform after 2015. The current usage metrics is available 48-96 hours after online publication and is updated daily on week days.
Initial download of the metrics may take a while.