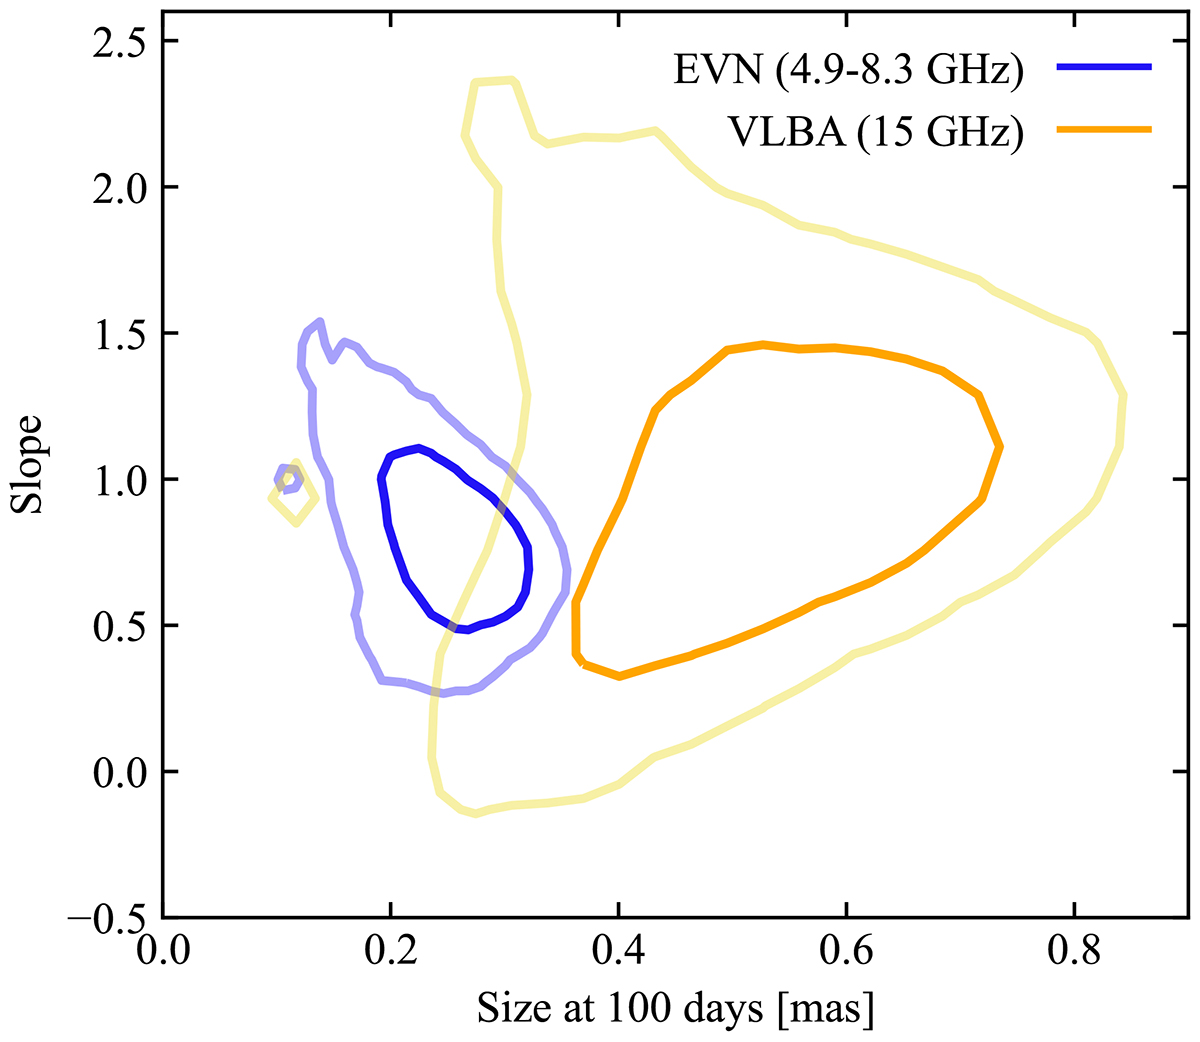
Fig. 3.
Download original image
Comparison of the slope and normalisation of the size evolution as probed by the EVN and the VLBA. The contours in the plot contain 68% (darker contours) and 95% (lighter contours) of the posterior probability on the two parameters (slope and size at a reference time of 100 days) of a single power law fitted to the EVN (blue) or VLBA (orange) size evolution.
Current usage metrics show cumulative count of Article Views (full-text article views including HTML views, PDF and ePub downloads, according to the available data) and Abstracts Views on Vision4Press platform.
Data correspond to usage on the plateform after 2015. The current usage metrics is available 48-96 hours after online publication and is updated daily on week days.
Initial download of the metrics may take a while.