Open Access
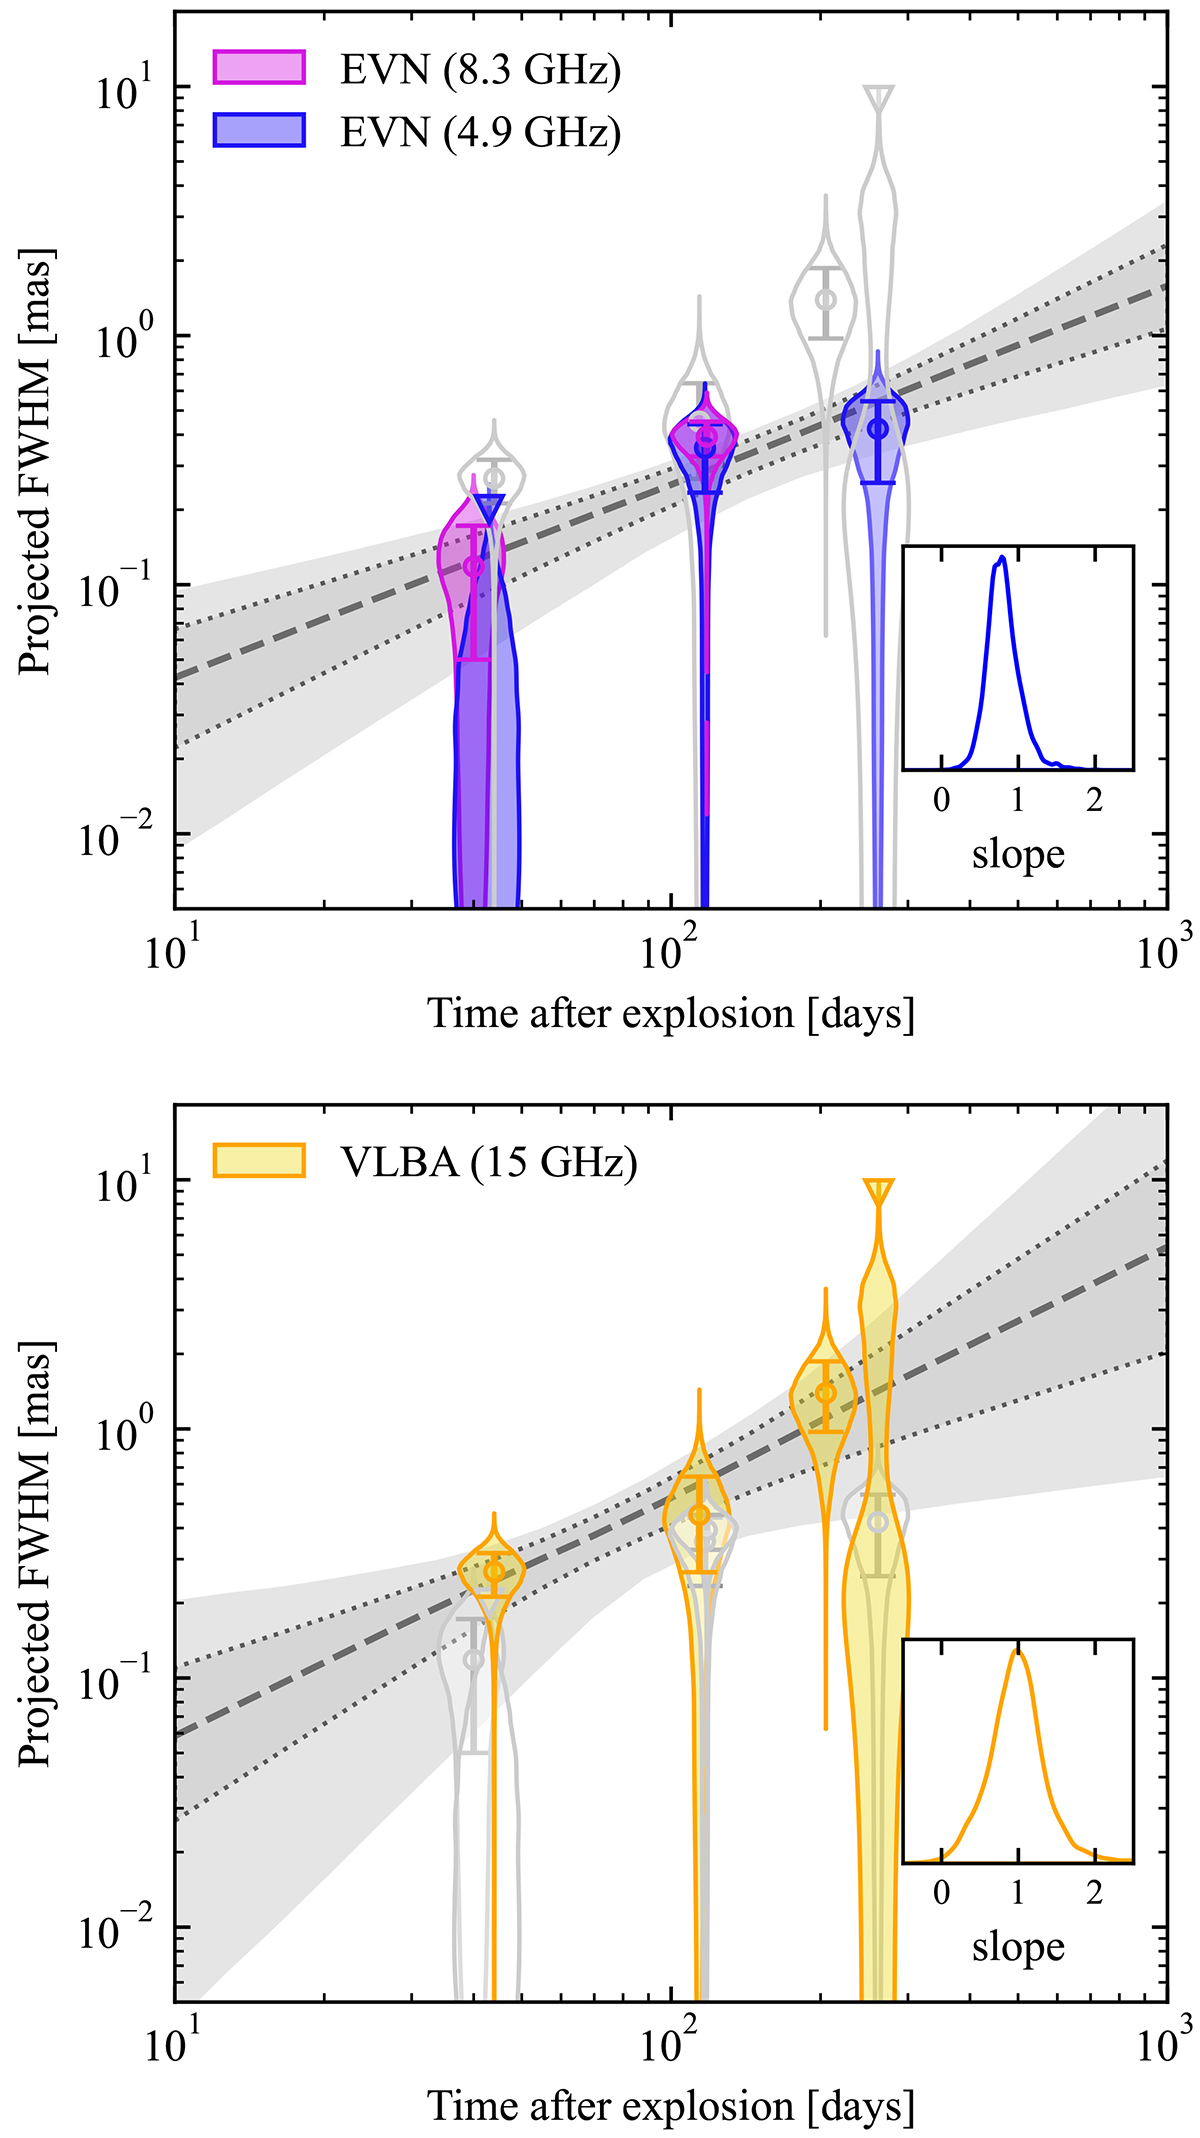
Fig. 2.
Download original image
Size evolution considering only observations from a single array (upper panel: EVN; lower panel: VLBA). Each panel is similar to Figure 1, except that the epochs not considered in the fit are shown with light grey shading for clarity.
Current usage metrics show cumulative count of Article Views (full-text article views including HTML views, PDF and ePub downloads, according to the available data) and Abstracts Views on Vision4Press platform.
Data correspond to usage on the plateform after 2015. The current usage metrics is available 48-96 hours after online publication and is updated daily on week days.
Initial download of the metrics may take a while.