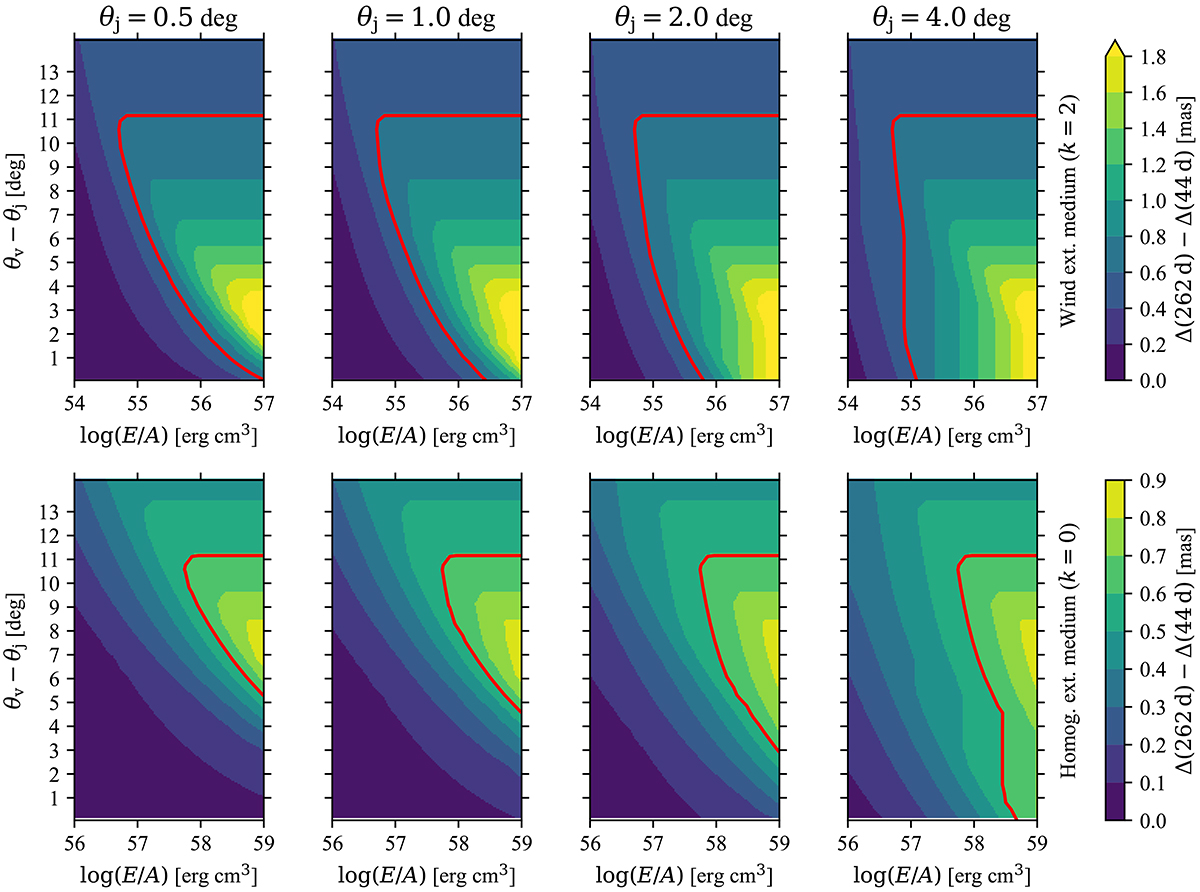
Fig. D.2.
Download original image
Constraint on the viewing angle from the absence of an observed source apparent displacement in our VLBA observations. In each panel, filled contours show the displacement of the centre of the fitted Gaussian expected between 44 d and 262 d, color coded as shown in the colorbar on the right, as a function of the E/A ratio and of the off-edge viewing angle θv − θj. The red contour shows Δ(262 d)−Δ(44 d) = 0.6 mas, which represents the largest displacement compatible at 1 σ with our observations. The red contour hence contains the excluded parameter region. The upper panel row refers to a wind-like external medium, while the lower row refers to a homogeneous external medium. Each column assumes a different jet half-opening angle, given at the top of the column.
Current usage metrics show cumulative count of Article Views (full-text article views including HTML views, PDF and ePub downloads, according to the available data) and Abstracts Views on Vision4Press platform.
Data correspond to usage on the plateform after 2015. The current usage metrics is available 48-96 hours after online publication and is updated daily on week days.
Initial download of the metrics may take a while.