Open Access
Fig. D.1.
Download original image
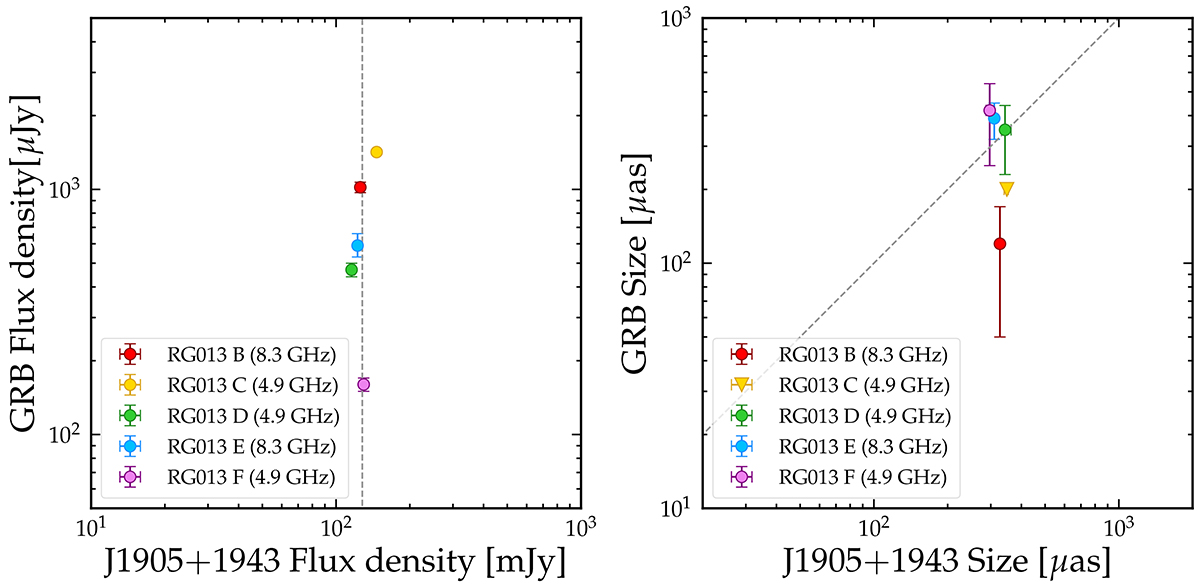
Flux density (left panel) and size (right panel) of GRB 221009A and J1905+1943 in the EVN observations. The average flux density of J1905+1943 (left panel) and the 1:1 correlation (right panel) are shown as grey dashed lines for the sake of comparison.
Current usage metrics show cumulative count of Article Views (full-text article views including HTML views, PDF and ePub downloads, according to the available data) and Abstracts Views on Vision4Press platform.
Data correspond to usage on the plateform after 2015. The current usage metrics is available 48-96 hours after online publication and is updated daily on week days.
Initial download of the metrics may take a while.