Fig. 8
Download original image
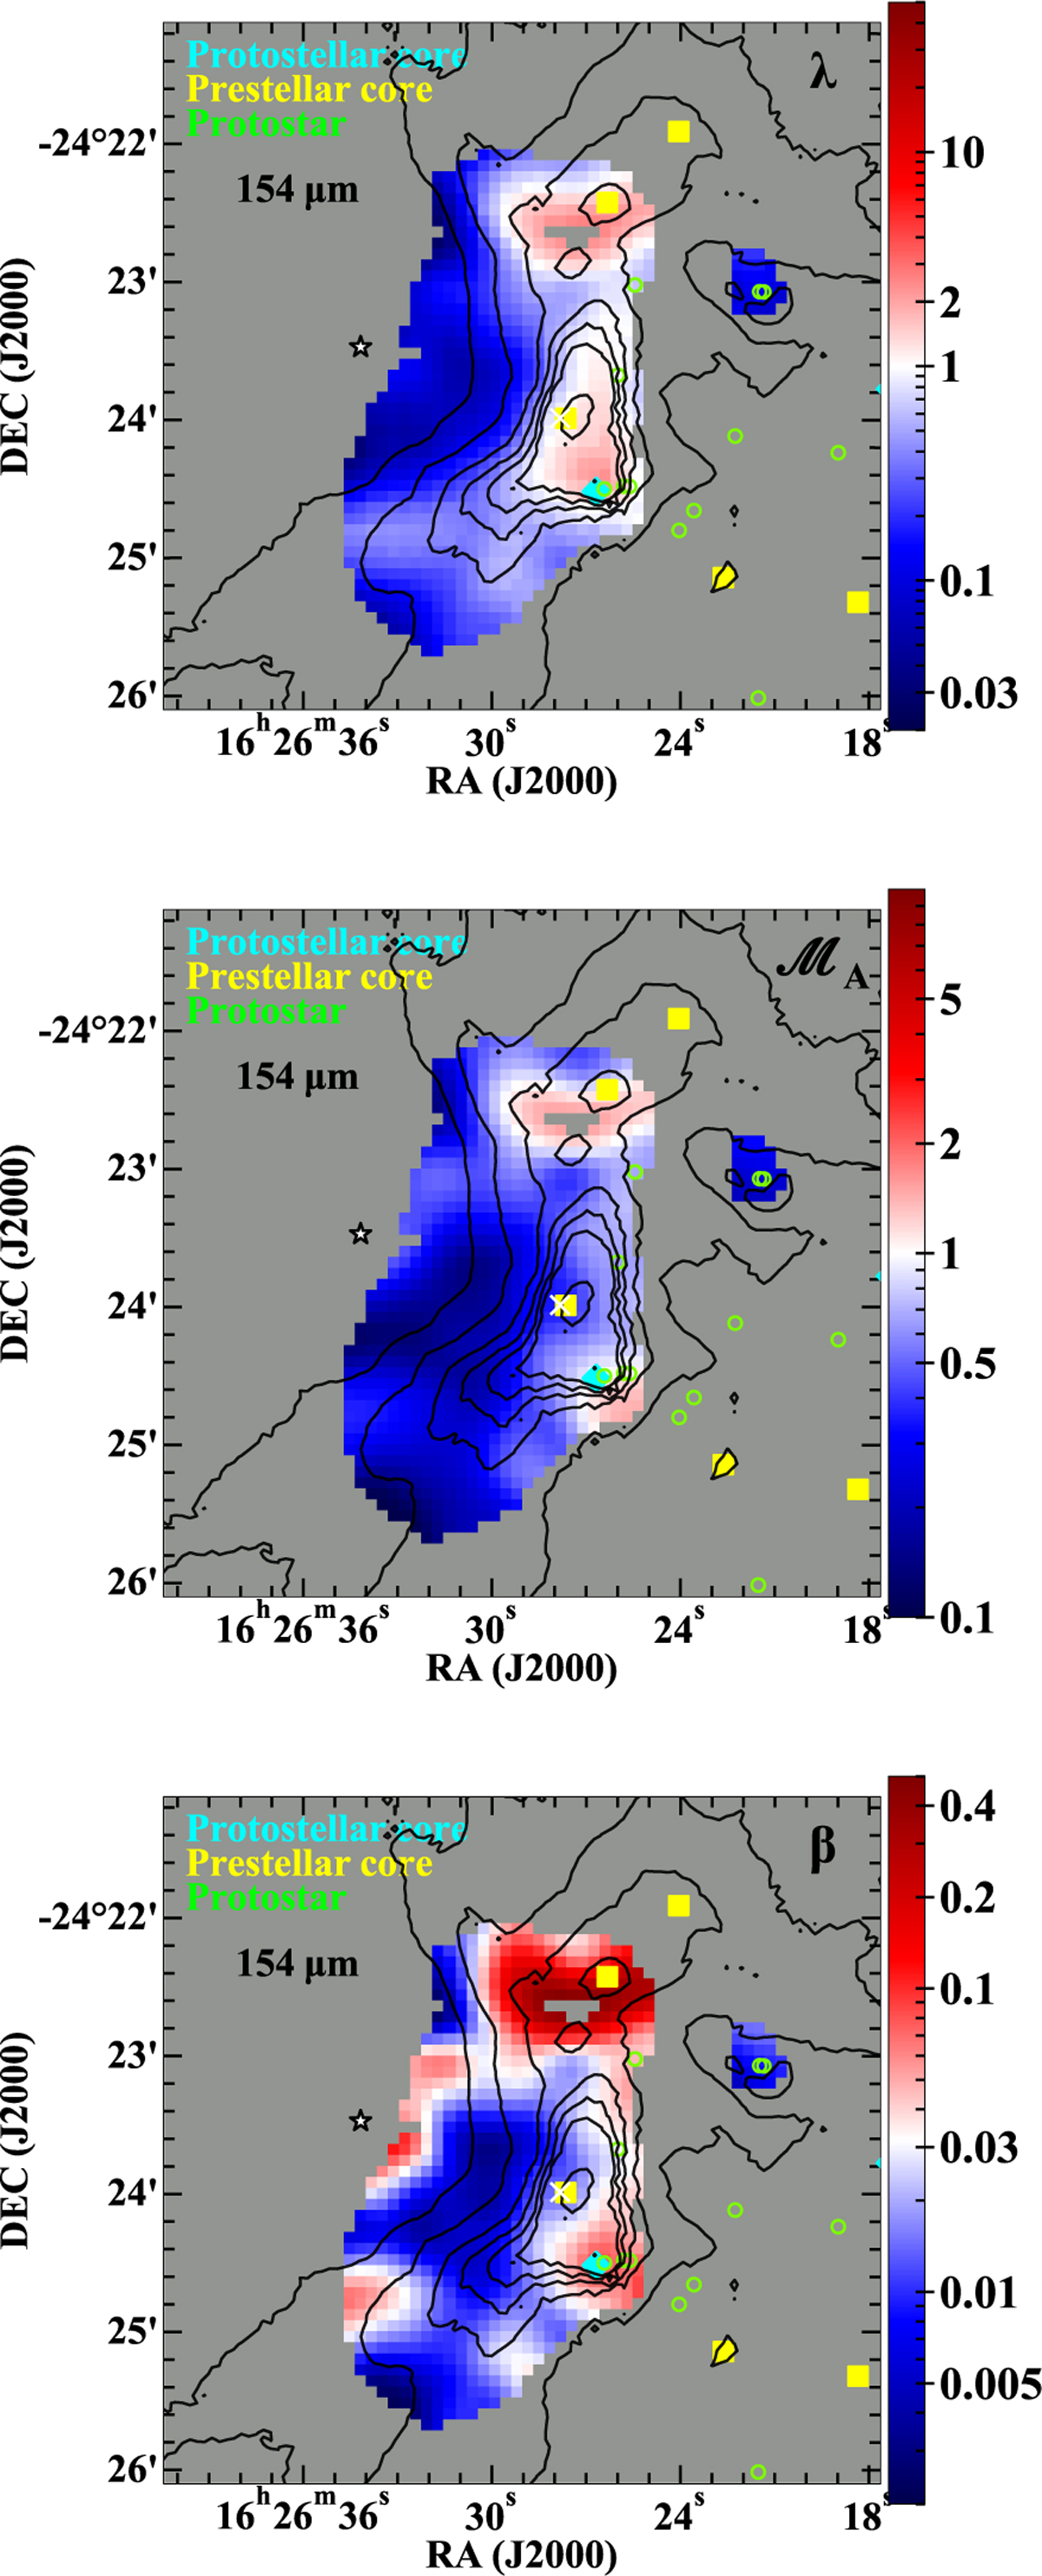
Maps of λ (top panel), Alfvén Mach number (middle panel), and plasma β parameter (bottom panel) in ρ Oph-A using the ![]() in band D. In each map, yellow square and cyan diamond symbols indicate the positions of prestellar and protostellar cores, respectively. Green circles indicate the positions of YSOs (Enoch et al. 2009; Evans et al. 2009; Connelley & Greene 2010). The star and “×” symbols mark the positions of the Oph-S1 star and the SM1 core, respectively. Black contours show
in band D. In each map, yellow square and cyan diamond symbols indicate the positions of prestellar and protostellar cores, respectively. Green circles indicate the positions of YSOs (Enoch et al. 2009; Evans et al. 2009; Connelley & Greene 2010). The star and “×” symbols mark the positions of the Oph-S1 star and the SM1 core, respectively. Black contours show ![]() , similar as in Fig. 1.
, similar as in Fig. 1.
Current usage metrics show cumulative count of Article Views (full-text article views including HTML views, PDF and ePub downloads, according to the available data) and Abstracts Views on Vision4Press platform.
Data correspond to usage on the plateform after 2015. The current usage metrics is available 48-96 hours after online publication and is updated daily on week days.
Initial download of the metrics may take a while.