Fig. 5
Download original image
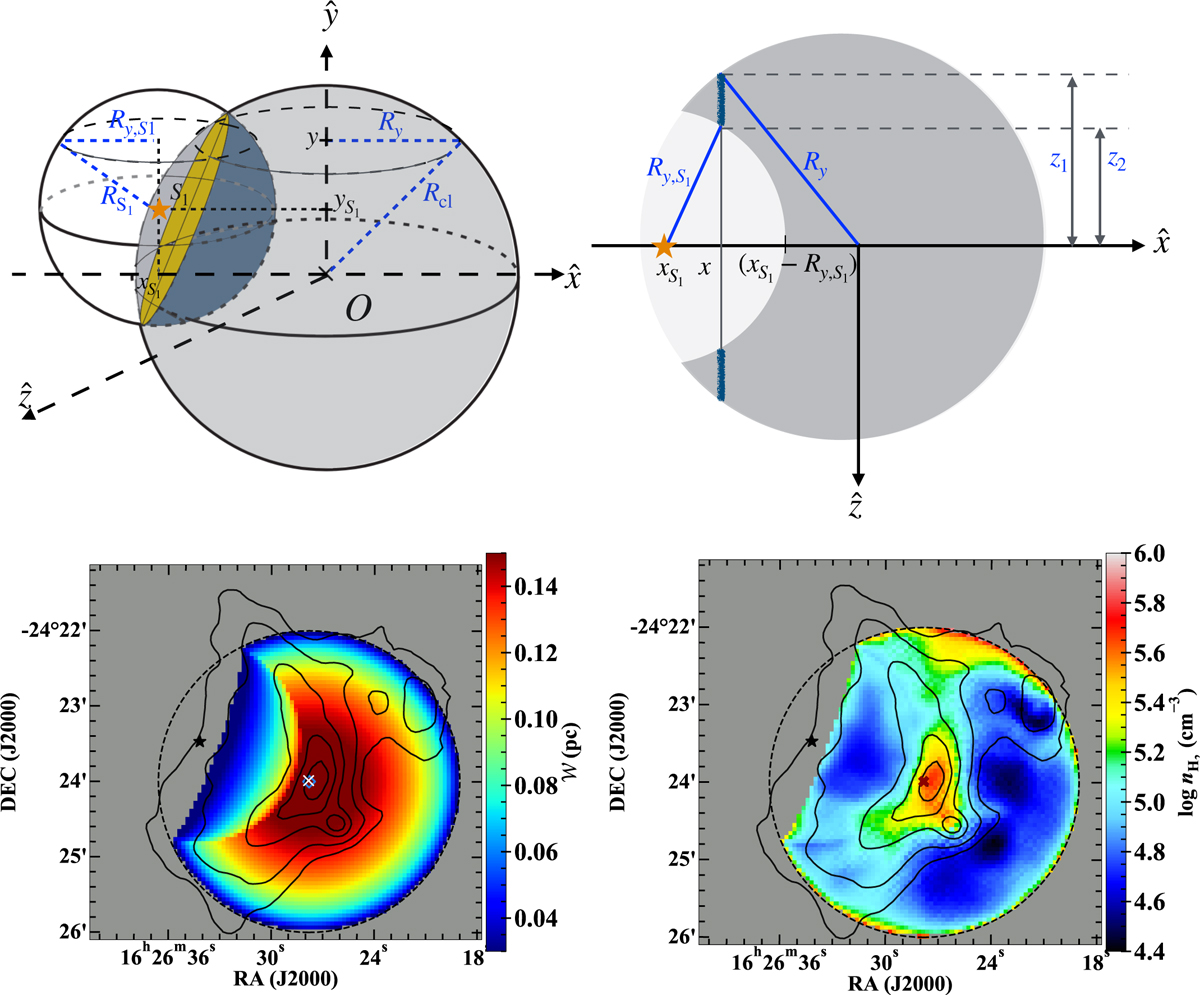
Cartoon of 3D structure of the ρ Oph-A cloud where we assume that the cloud has a spherical shape but is pushed by radiation feedback from a nearby high-mass star Oph-S1, shown at the top (left panel, see text) and a plane of the constant coordinate y with the LOS ![]() (right panel). Bottom row displays the map of the depth of the cloud, W (left panel), and the map of the gas volume density
(right panel). Bottom row displays the map of the depth of the cloud, W (left panel), and the map of the gas volume density ![]() inferred from
inferred from ![]() (right panel). In each panel, the “×” and star symbols mark the peak position of
(right panel). In each panel, the “×” and star symbols mark the peak position of ![]() and location of Oph-S1 star, respectively. Toward maps of W and
and location of Oph-S1 star, respectively. Toward maps of W and ![]() in bottom panels, the black dashed circle has a radius Rcl=120″ and black solid contours show the continuum emission at 154 μm with levels similar as shown in Fig. 4.
in bottom panels, the black dashed circle has a radius Rcl=120″ and black solid contours show the continuum emission at 154 μm with levels similar as shown in Fig. 4.
Current usage metrics show cumulative count of Article Views (full-text article views including HTML views, PDF and ePub downloads, according to the available data) and Abstracts Views on Vision4Press platform.
Data correspond to usage on the plateform after 2015. The current usage metrics is available 48-96 hours after online publication and is updated daily on week days.
Initial download of the metrics may take a while.