Fig. 12
Download original image
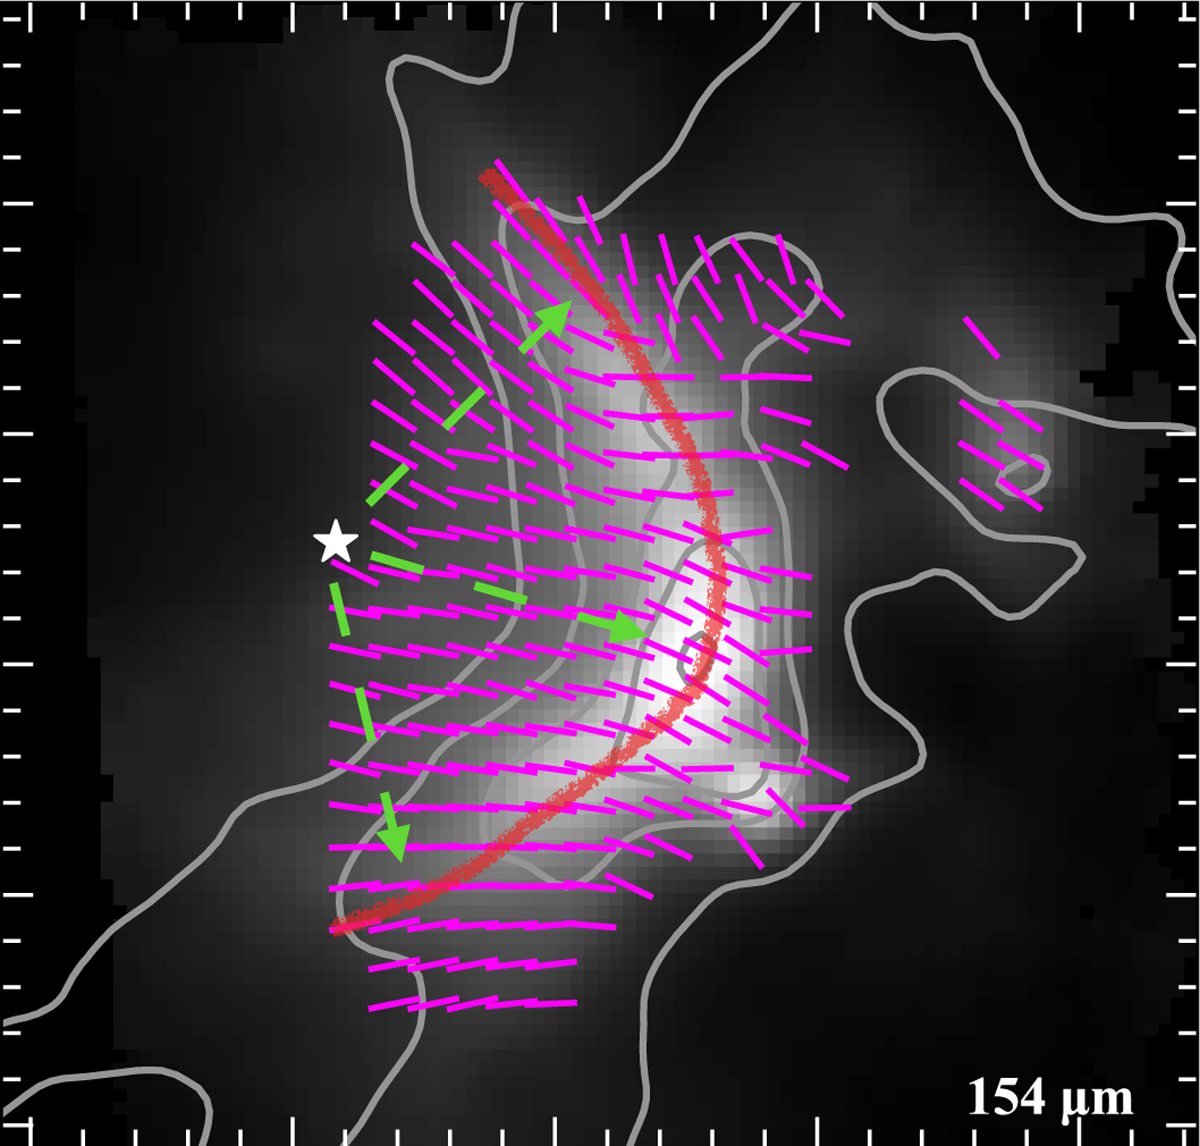
Image of the continuum emission at 154 μm toward Oph-A. B-field vectors obtained from SOFIA/HAWC+ at 154 μm are shown in magenta solid segments. The green dashed arrows indicate the radiation directions from the Oph-S1 star toward the cloud. The white star marks the position of the Oph-S1 star. The red curve illustrates the elongated shape of the ridge in the dense cloud. The gray contours are the H2 column density, with contour levels at (1, 2, 5, 10, 20)×l022 cm−2.
Current usage metrics show cumulative count of Article Views (full-text article views including HTML views, PDF and ePub downloads, according to the available data) and Abstracts Views on Vision4Press platform.
Data correspond to usage on the plateform after 2015. The current usage metrics is available 48-96 hours after online publication and is updated daily on week days.
Initial download of the metrics may take a while.