Fig. 11
Download original image
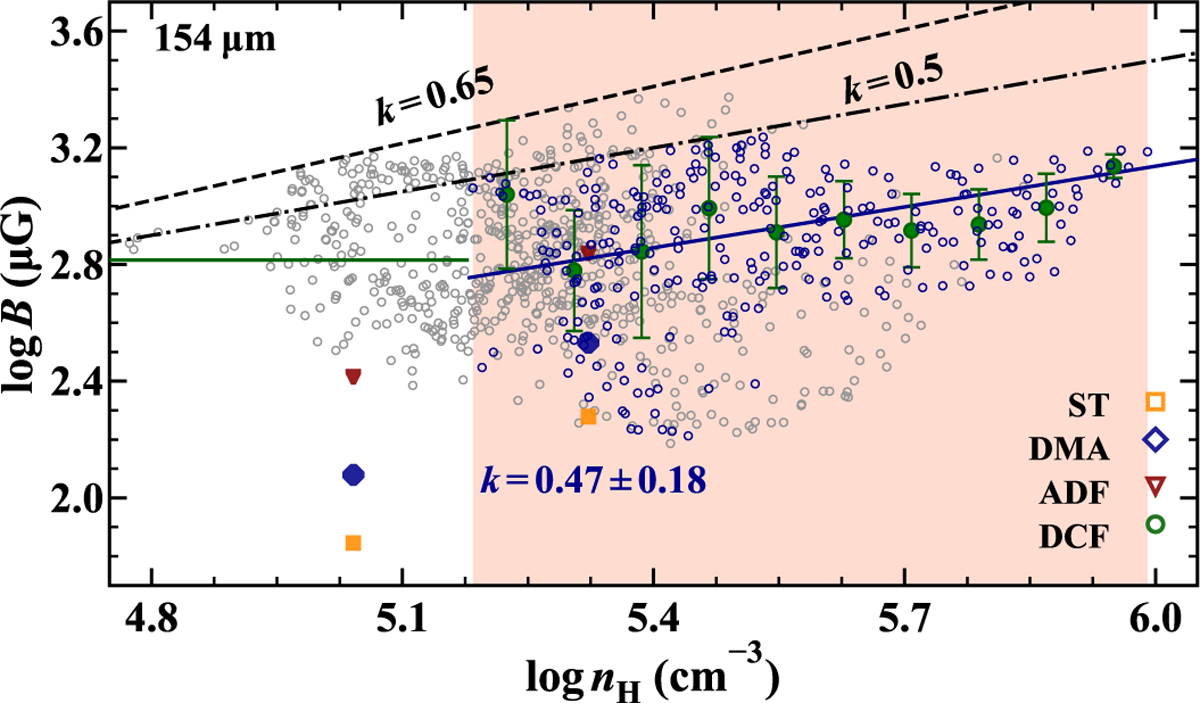
Correlation between log B and log nH in ρ Oph-A. Small circles represent B strength estimated with the DCF method at band D. Small circles in blue further represent data within the region where Stokes-I ≥ 0.4 Jy/arcsec2, corresponding to the densities log nH ≥ 5.2. The bigger circles in green represent median values of B binned in each interval of log nH of ~0.08 (see texts). Mean values of B estimated with ADF (red triangles), DMA (blue diamonds), and ST (orange squares) methods toward subregion (a) and (e) are overplotted. The solid green line represents the median value log B ≈ 2.81 at low densities. The solid blue line shows the power-law fit toward the binned data of B using the DCF method toward more denser region (covered by the orange shaded box), resulting k = 0.47 ± 0.18. The black dash-dotted line indicates the critical power-law ![]() for strong B-fields, predicted from the theoretical models (Mouschovias & Ciolek 1999). The black dashed line indicates the relation found by Crutcher et al. (2010) using the Zeeman observational data.
for strong B-fields, predicted from the theoretical models (Mouschovias & Ciolek 1999). The black dashed line indicates the relation found by Crutcher et al. (2010) using the Zeeman observational data.
Current usage metrics show cumulative count of Article Views (full-text article views including HTML views, PDF and ePub downloads, according to the available data) and Abstracts Views on Vision4Press platform.
Data correspond to usage on the plateform after 2015. The current usage metrics is available 48-96 hours after online publication and is updated daily on week days.
Initial download of the metrics may take a while.