Fig. 10
Download original image
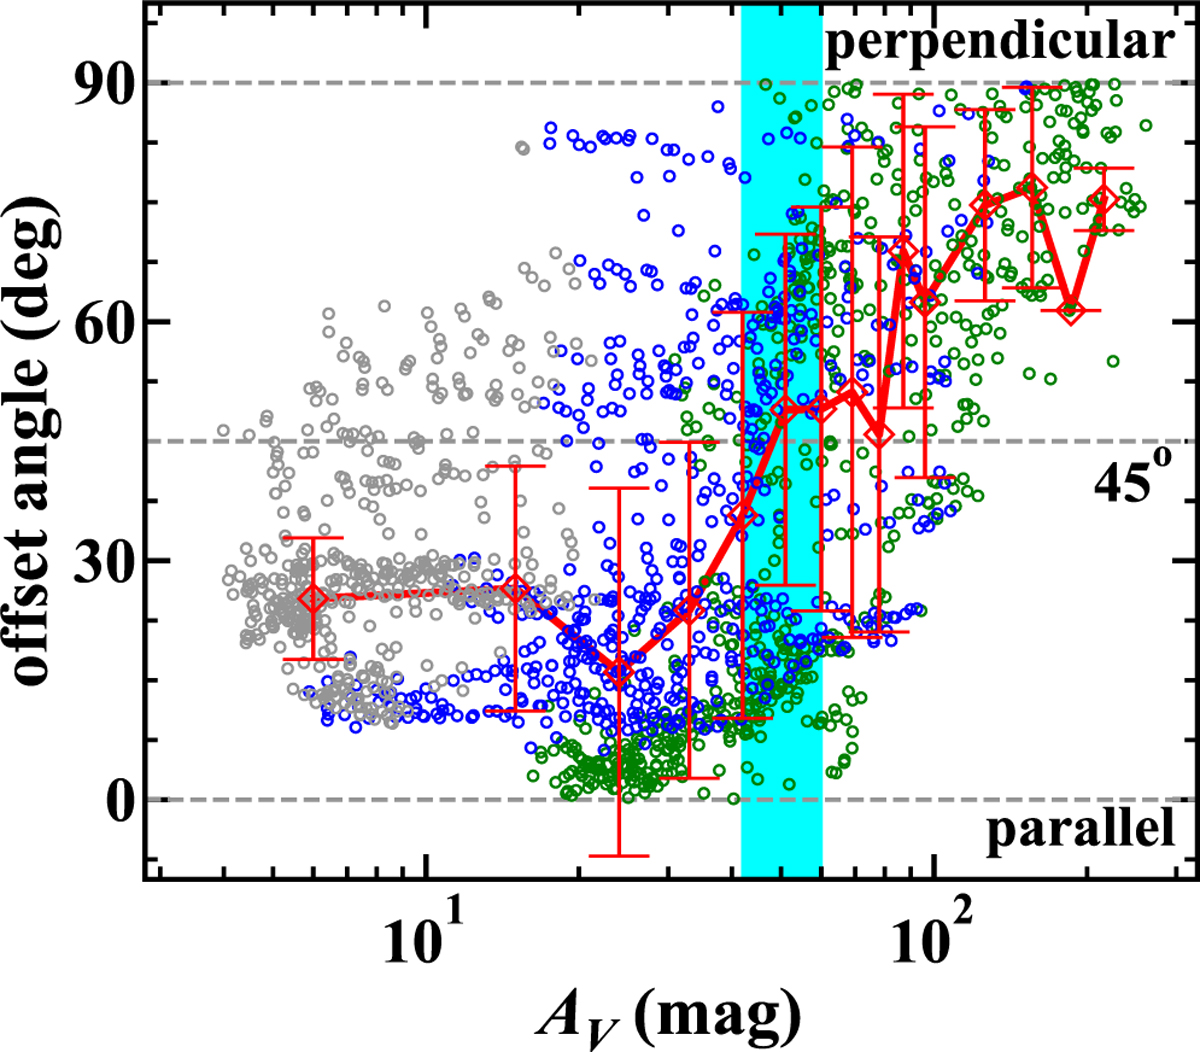
Distribution of the offset angles between the orientations of B-fields and the ridge in ρ Oph-A, as a function of AV (circle symbols). The data in gray color represent the offset angle collected within the black circle “I” centered at the position of the Oph-S1 star with a radius of 60″ in Fig. 9. The data in blue and green additionally represent the offset angle collected within the two rings “II” and “III” in Fig. 9, respectively. The red diamonds represent the median value of the offset angles in each interval of AV=3 mag. The number of red diamonds is reduced to improve the clarity of the figure. The red curve connecting all the red diamonds shows the trend of the offset angles vs. AV in ρ Oph-A. The cyan box indicates the range of AV=42–60 mag where relative orientation between B-fields and the ridge changes from parallel to perpendicular. The gray horizontal dashed lines indicate perpendicular, 45°, and parallel relative orientations of B-fields with respect to the ridge.
Current usage metrics show cumulative count of Article Views (full-text article views including HTML views, PDF and ePub downloads, according to the available data) and Abstracts Views on Vision4Press platform.
Data correspond to usage on the plateform after 2015. The current usage metrics is available 48-96 hours after online publication and is updated daily on week days.
Initial download of the metrics may take a while.