Fig. 1
Download original image
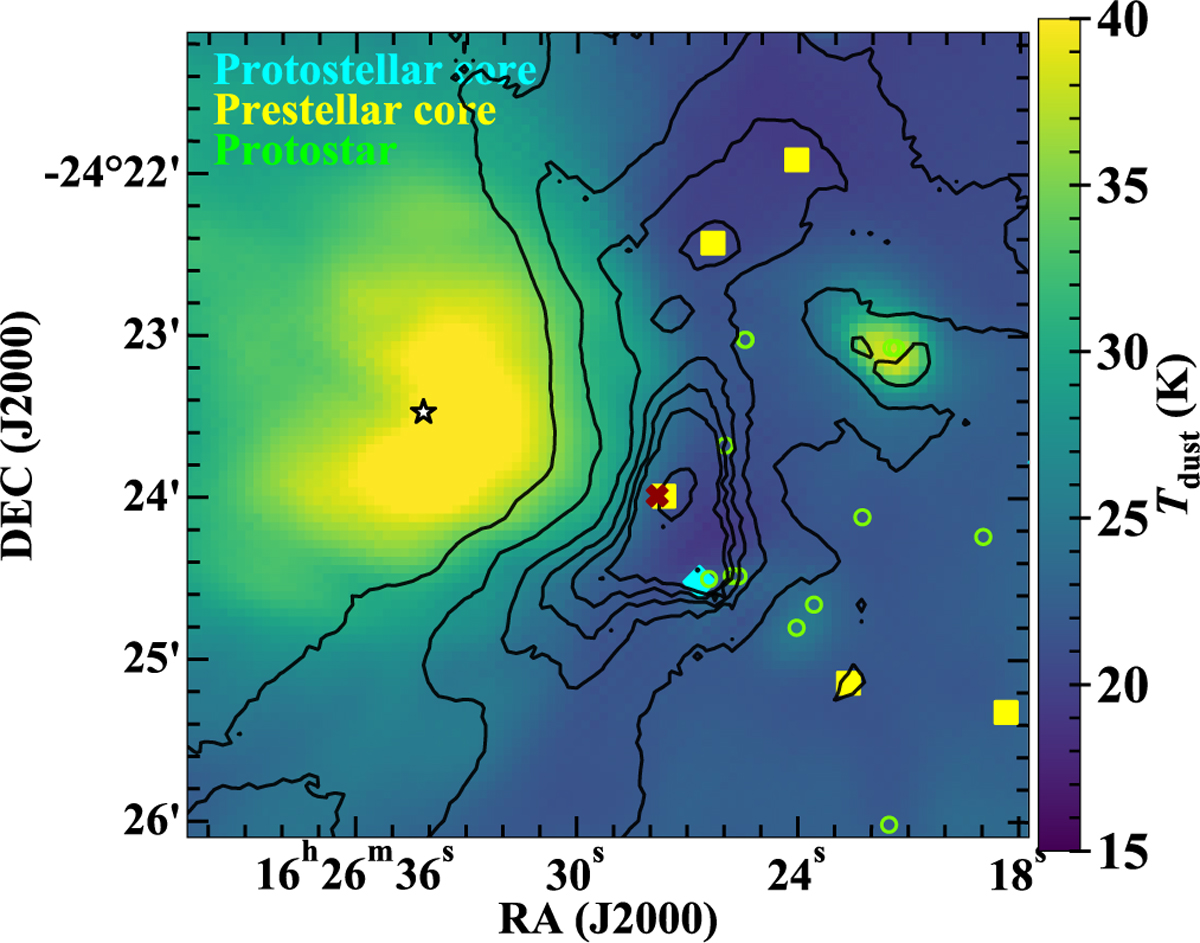
Distribution of dust temperatures (colors) and H2 column densities (contours) in ρ Oph-A (Santos et al. 2019). Contour levels of ![]() are shown at (1, 2, 4, 6, 8, and 10) × 1022 cm−2. The star symbol shows the position of Oph-S1. Small circles show the positions of YSOs (Enoch et al. 2009; Evans et al. 2009; Connelley & Greene 2010). Yellow squares and cyan diamonds indicate the positions of prestellar and protostellar cores, respectively, identified as part of the Herschel Gould Belt Survey (Ladjelate et al. 2020). The “×” symbol shows the position of the SM1 core.
are shown at (1, 2, 4, 6, 8, and 10) × 1022 cm−2. The star symbol shows the position of Oph-S1. Small circles show the positions of YSOs (Enoch et al. 2009; Evans et al. 2009; Connelley & Greene 2010). Yellow squares and cyan diamonds indicate the positions of prestellar and protostellar cores, respectively, identified as part of the Herschel Gould Belt Survey (Ladjelate et al. 2020). The “×” symbol shows the position of the SM1 core.
Current usage metrics show cumulative count of Article Views (full-text article views including HTML views, PDF and ePub downloads, according to the available data) and Abstracts Views on Vision4Press platform.
Data correspond to usage on the plateform after 2015. The current usage metrics is available 48-96 hours after online publication and is updated daily on week days.
Initial download of the metrics may take a while.