Fig. 9.
Download original image
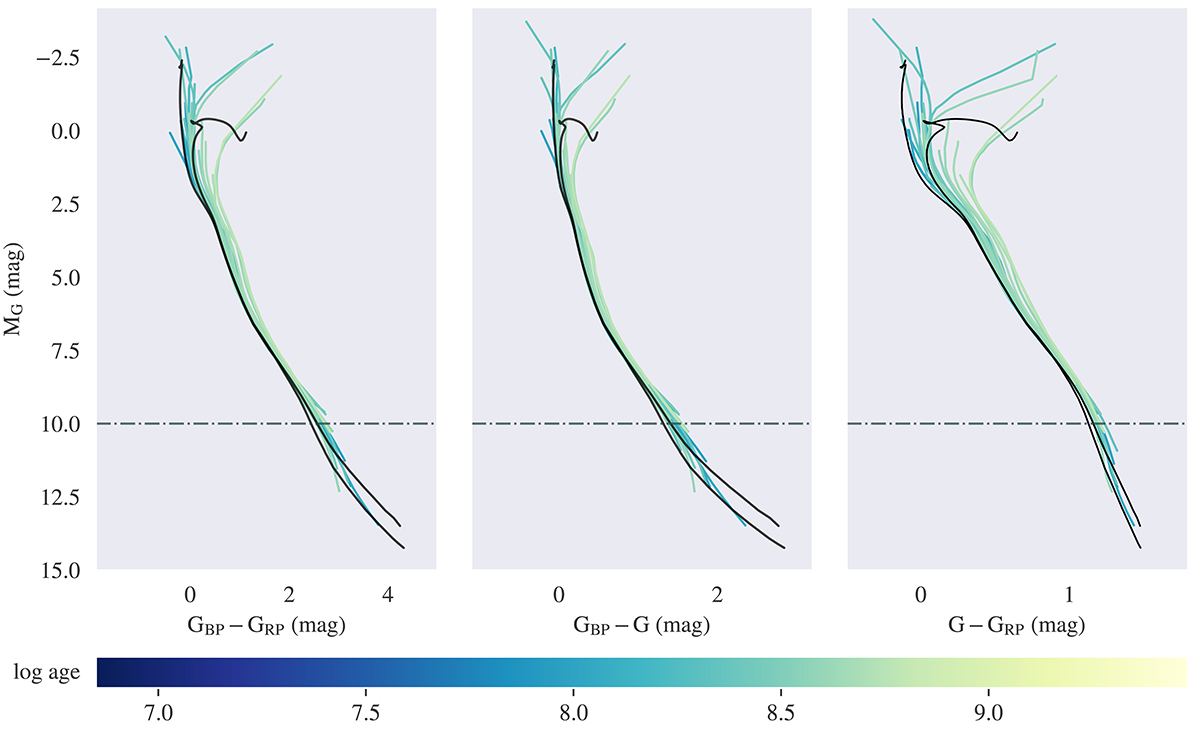
Visualization of empirical isochrones compared with theoretical ones for the previously described isochrone blindspot (∼100 − 500 Myr). The black lines correspond to model isochrones delineating the edges of the blindspot region, using PARSEC with default parameters. The colored lines are all empirical isochrones belonging to clusters with estimated ages in this age range.
Current usage metrics show cumulative count of Article Views (full-text article views including HTML views, PDF and ePub downloads, according to the available data) and Abstracts Views on Vision4Press platform.
Data correspond to usage on the plateform after 2015. The current usage metrics is available 48-96 hours after online publication and is updated daily on week days.
Initial download of the metrics may take a while.