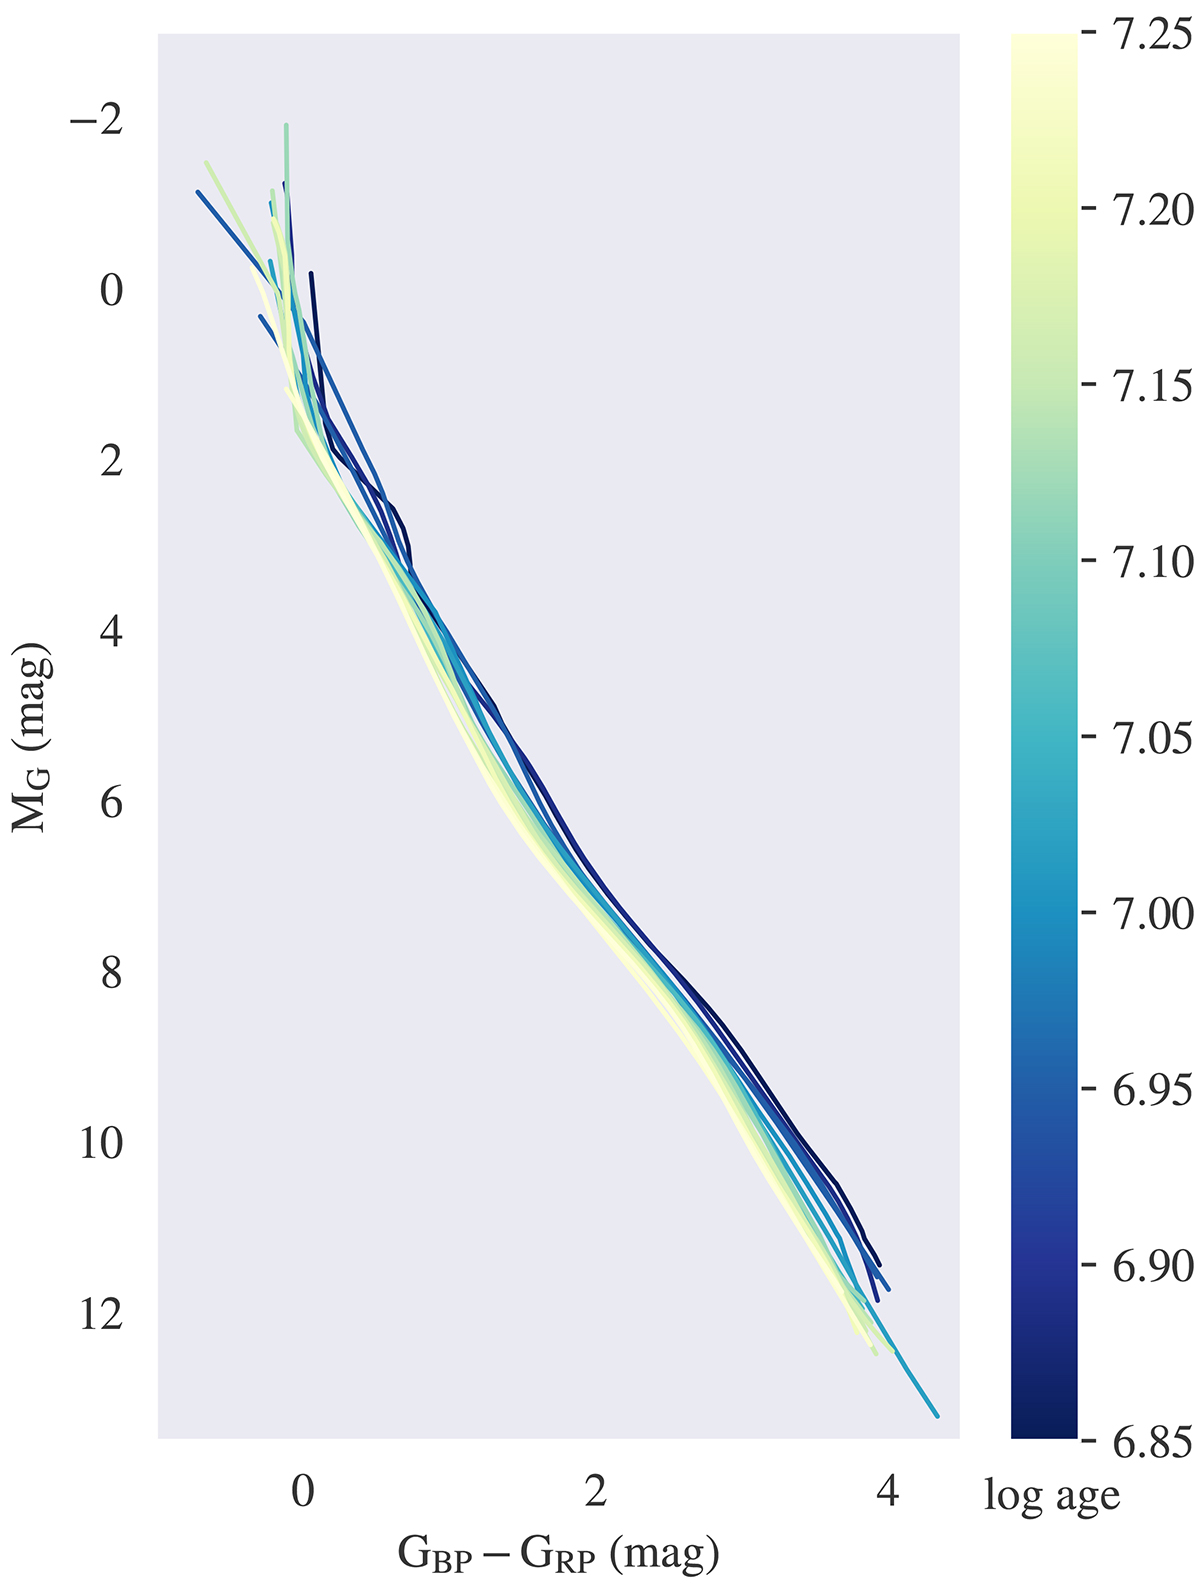
Fig. 8.
Download original image
Summary plot of empirical isochrones derived for the 16 clusters out of the 34 groups discovered in the Sco-Cen complex (Ratzenböck et al. 2023b), which are in the empirical isochrone archive. The lines are color-coded in accordance with the estimated ages published in Ratzenböck et al. (2023a). The age sequence constitutes an almost perfect fit to the empirical isochrone shapes and positions within the CMD.
Current usage metrics show cumulative count of Article Views (full-text article views including HTML views, PDF and ePub downloads, according to the available data) and Abstracts Views on Vision4Press platform.
Data correspond to usage on the plateform after 2015. The current usage metrics is available 48-96 hours after online publication and is updated daily on week days.
Initial download of the metrics may take a while.