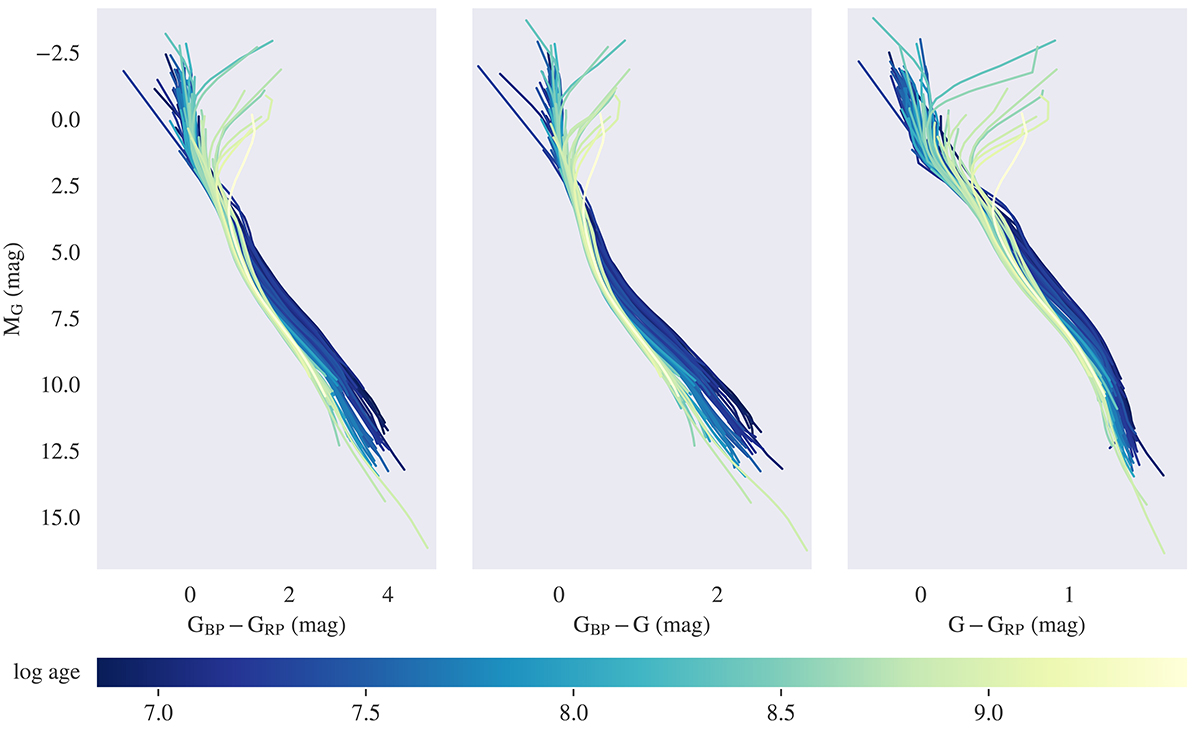
Fig. 7.
Download original image
Summary plot of all Gaia empirical isochrones calculated for the 83 archive clusters, shown for the three different color indices GBP − GRP, GBP − G, and G − GRP. The color coding of the isochrones corresponds to the estimated cluster age found in the literature (see Table 1 for details). An interactive version of the figure is also available online.
Current usage metrics show cumulative count of Article Views (full-text article views including HTML views, PDF and ePub downloads, according to the available data) and Abstracts Views on Vision4Press platform.
Data correspond to usage on the plateform after 2015. The current usage metrics is available 48-96 hours after online publication and is updated daily on week days.
Initial download of the metrics may take a while.