Fig. 6.
Download original image
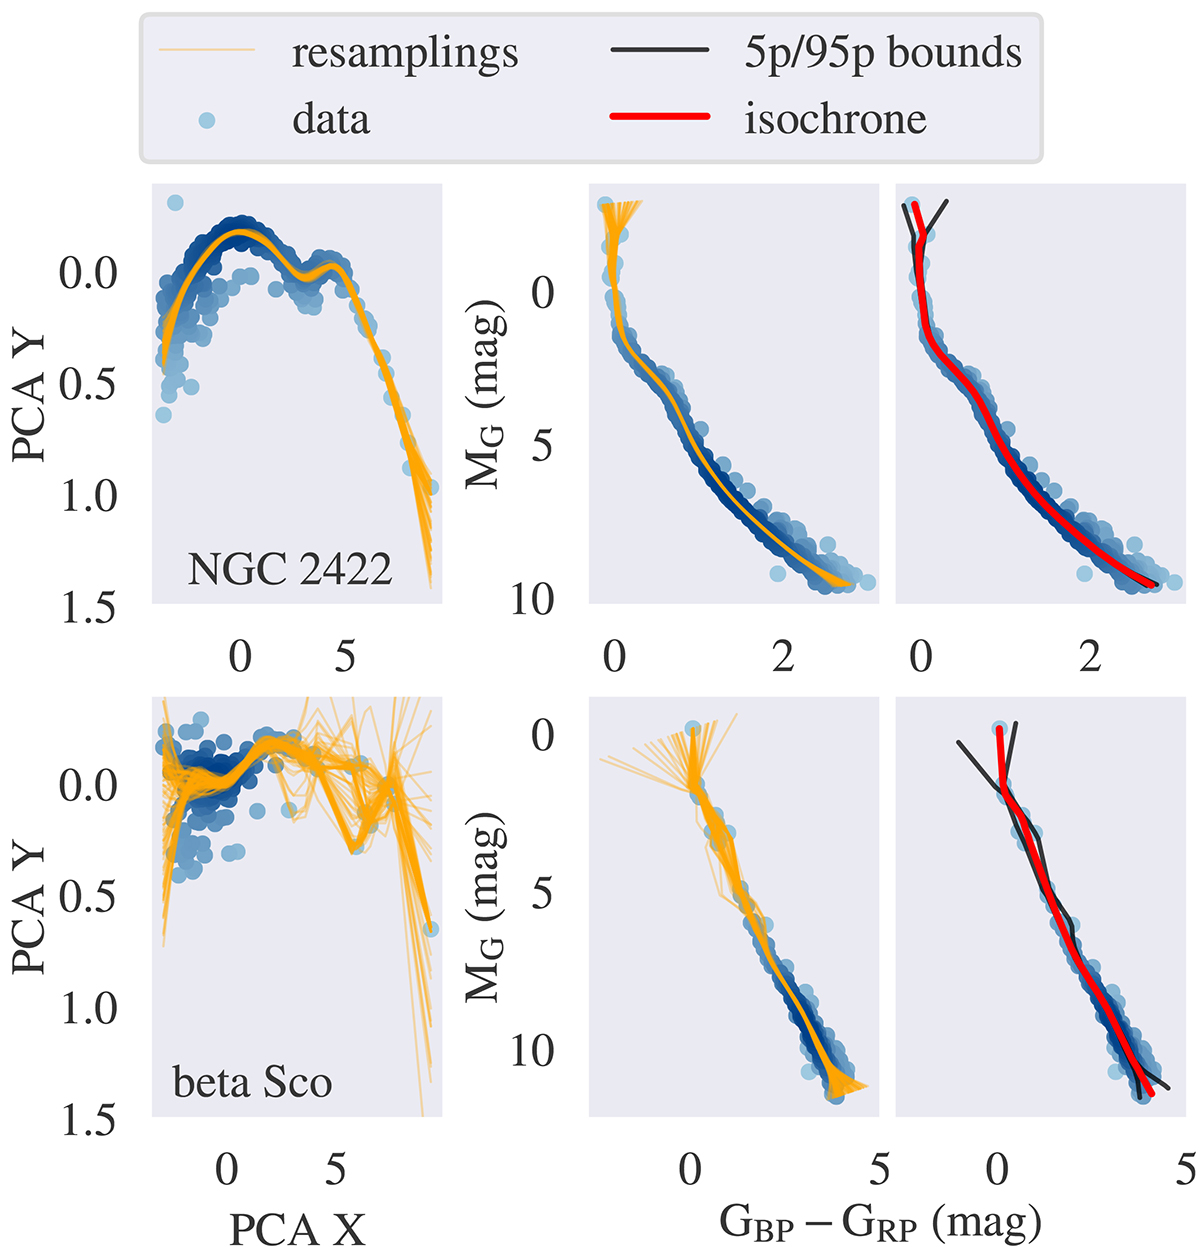
Illustration of the bootstrapping and resampling process. The procedure is shown for the well-behaved cluster NGC 2422 (top row), and the more scattered beta Sco group (bottom row). The orange lines in the left column of the figure indicate 100 resampled SVR isochrones created via bootstrapping of the PCA cluster data. The center column depicts the same lines projected into the respective cluster CMD. The right column shows the median (red line), 5th and 95th percentile boundaries (black lines) calculated from the resampled set.
Current usage metrics show cumulative count of Article Views (full-text article views including HTML views, PDF and ePub downloads, according to the available data) and Abstracts Views on Vision4Press platform.
Data correspond to usage on the plateform after 2015. The current usage metrics is available 48-96 hours after online publication and is updated daily on week days.
Initial download of the metrics may take a while.