Fig. 5.
Download original image
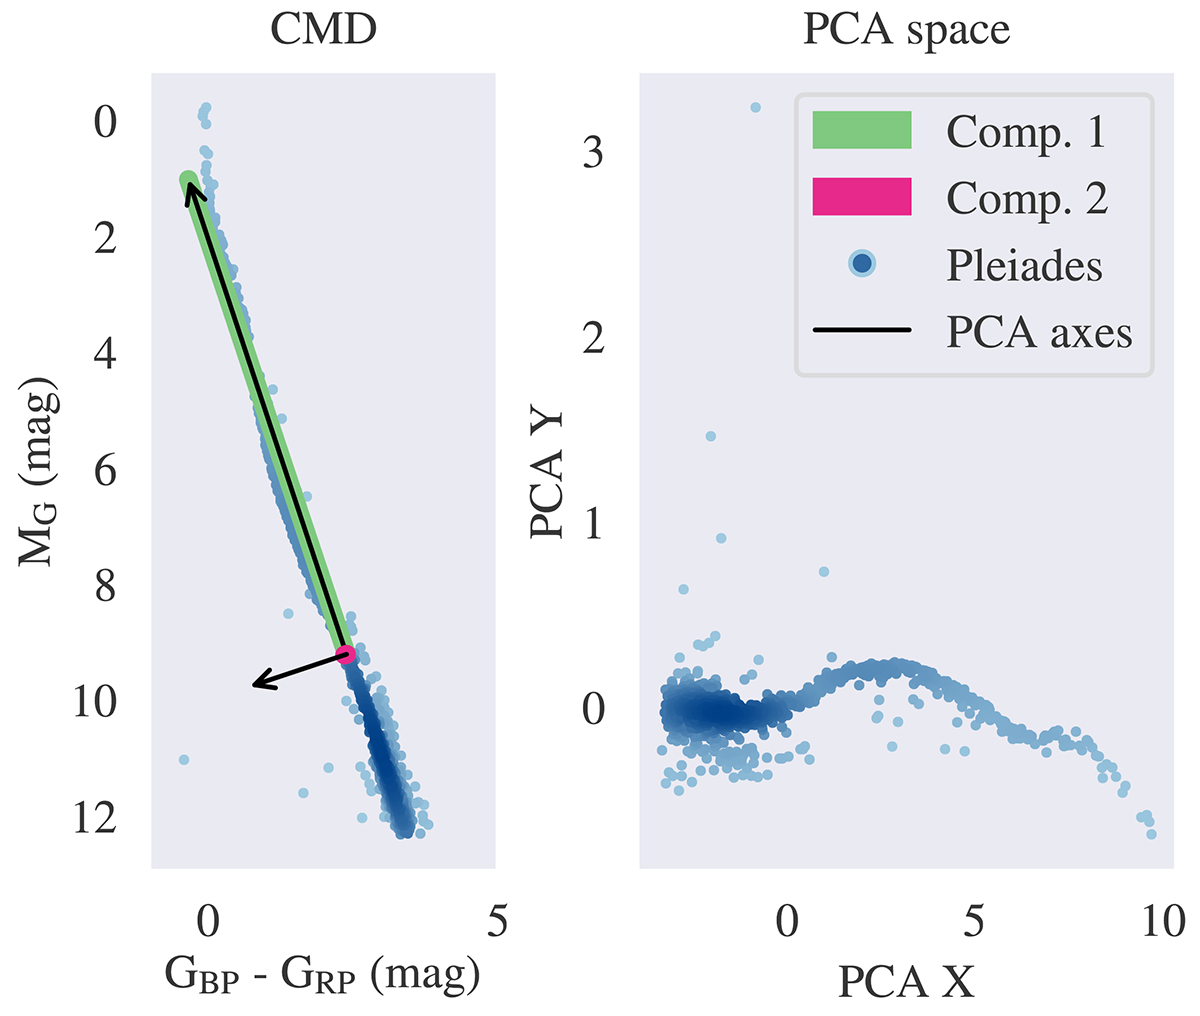
Illustration of a PCA transformation of CMD data on the example of the Pleiades cluster. Left: extent and orientation of the principal components. The first component (green) is much larger than the second one (magenta), reflecting the different orders of magnitude of variance in the observation matrix. The directions of the PCA space axes are denoted by black arrows, with the second one magnified by a factor of 50 for better visibility. Right: transformed cluster data in PCA space, with the new axes pointing in the direction of the two principal components.
Current usage metrics show cumulative count of Article Views (full-text article views including HTML views, PDF and ePub downloads, according to the available data) and Abstracts Views on Vision4Press platform.
Data correspond to usage on the plateform after 2015. The current usage metrics is available 48-96 hours after online publication and is updated daily on week days.
Initial download of the metrics may take a while.