Fig. E.5.
Download original image
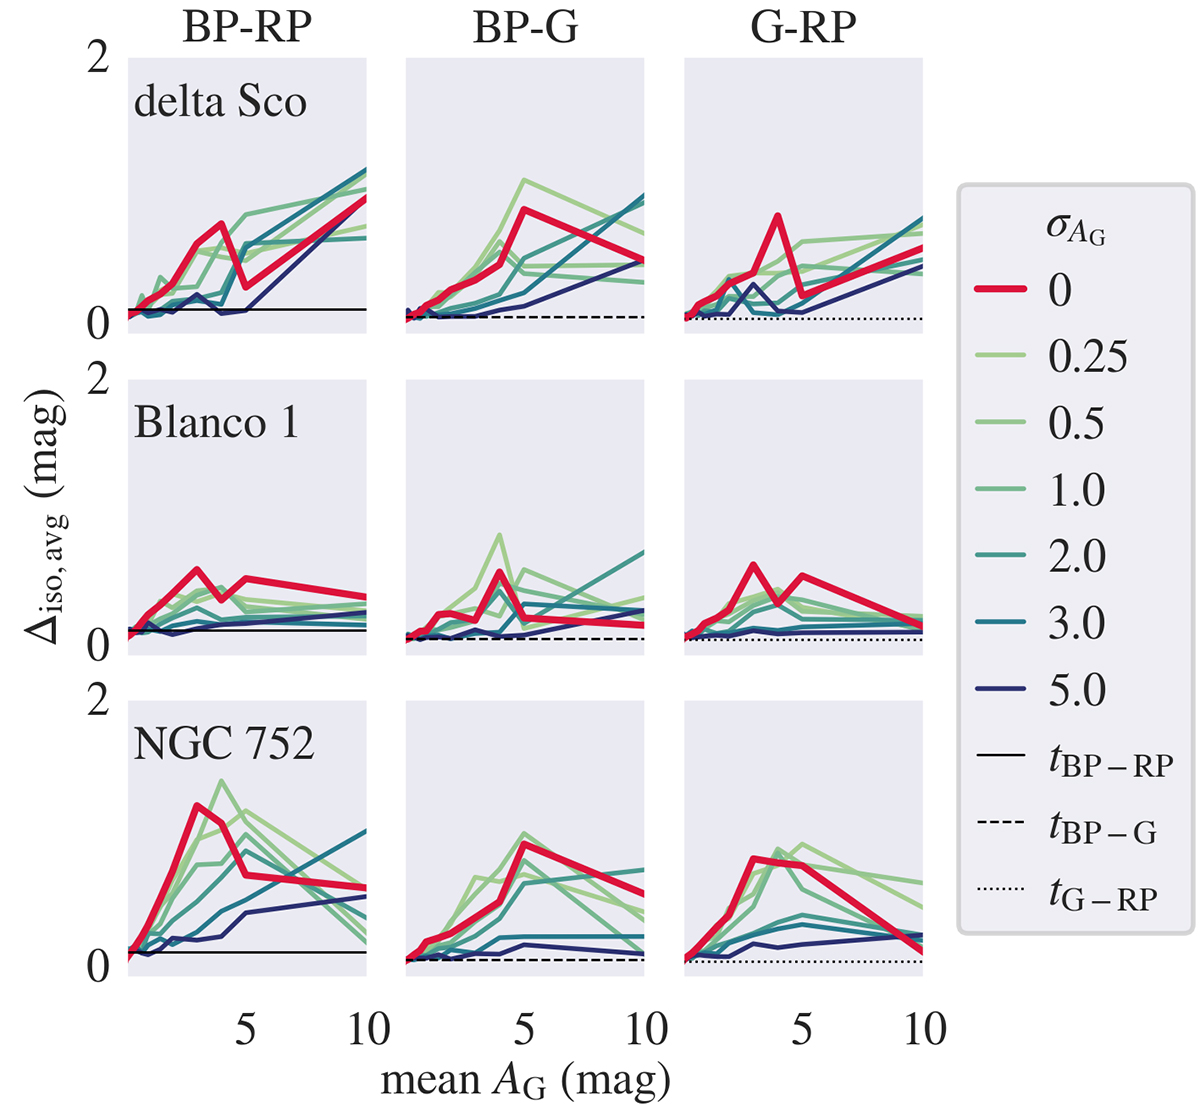
Evolution of the isochrone deviation score in dependence of the mean extinction level, for different Gaussian noise additions with mean zero and standard deviations σAG. The evolution given a flat extinction level is indicated by the red line. The different rows and columns showcase the plots for the different example clusters and CMD passband combinations, respectively. The empirical reliability thresholds are indicated by the black lines in each panel.
Current usage metrics show cumulative count of Article Views (full-text article views including HTML views, PDF and ePub downloads, according to the available data) and Abstracts Views on Vision4Press platform.
Data correspond to usage on the plateform after 2015. The current usage metrics is available 48-96 hours after online publication and is updated daily on week days.
Initial download of the metrics may take a while.