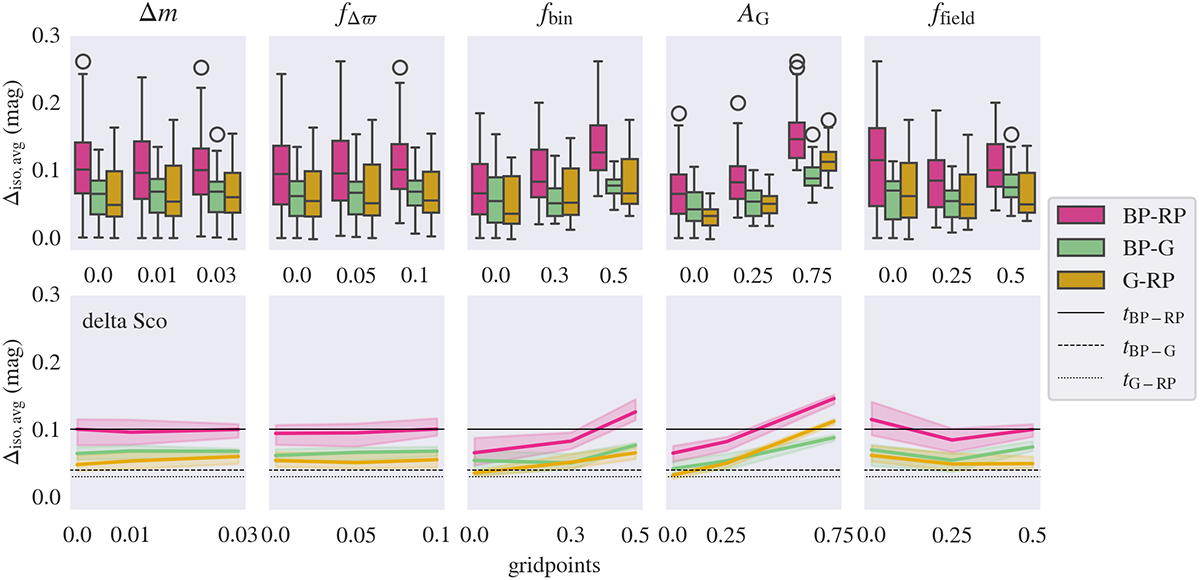
Fig. E.2.
Download original image
Sensitivity analysis of the empirical isochronal shapes in dependence on the parameters Δm, fΔϖ, fbin, AG, and ffield for the representative young cluster delta Sco, with a median distance of ∼142 pc and an estimated age of ∼7.8 Myr (Ratzenböck et al. 2023a). Top row: Boxplots illustrating the effects of the systematically varied factors on the averaged deviation score Δiso, avg, analyzed through a full factorial design. Each boxplot represents the deviation scores of all grid points containing the indicated value on the corresponding x-axis tick label. Bottom row: Same as the top row, but this time only showing the evolution of the median Δiso, avg at each grid point, along with the 95 % confidence interval estimation. The color coding corresponds to the different Gaia passband combinations. The black lines mark the empirical thresholds determined for each passband, respectively.
Current usage metrics show cumulative count of Article Views (full-text article views including HTML views, PDF and ePub downloads, according to the available data) and Abstracts Views on Vision4Press platform.
Data correspond to usage on the plateform after 2015. The current usage metrics is available 48-96 hours after online publication and is updated daily on week days.
Initial download of the metrics may take a while.