Fig. 13.
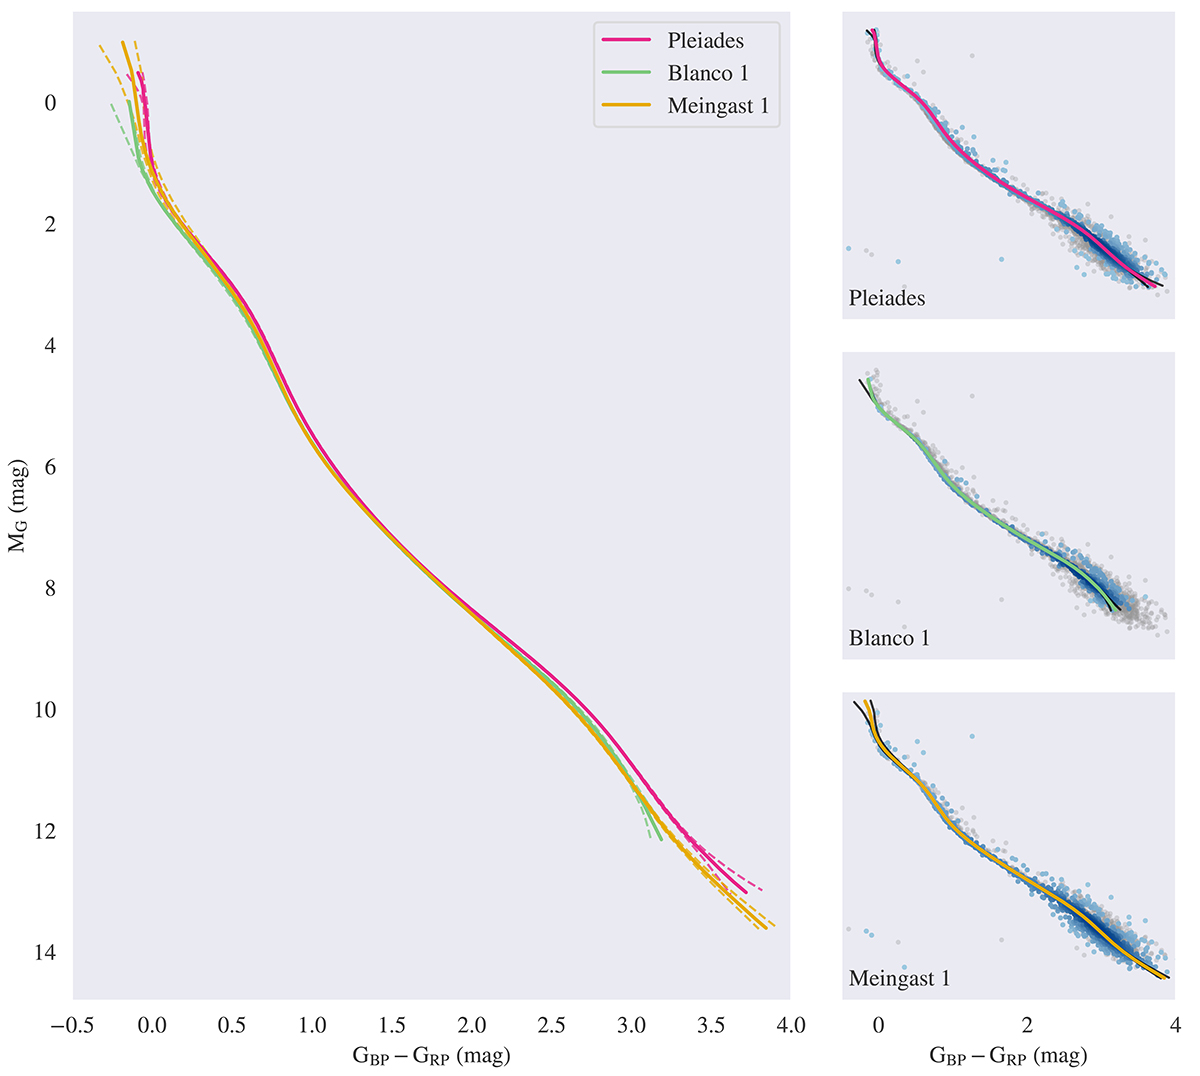
Download original image
Age bracketing of the Meingast 1 stream with empirical isochrones, whose corresponding cluster CMDs are shown in the right column of the figure. The gray points indicate the combined data of all three clusters, and the population connected to the plotted isochrone is overlaid in blue. By comparing the empirical isochrone of the stellar stream (yellow line) with similar archive isochrones, we bracketed the stream and, in extension, its relative age, by the Pleiades (magenta line) and by the Blanco 1 cluster (green line).
Current usage metrics show cumulative count of Article Views (full-text article views including HTML views, PDF and ePub downloads, according to the available data) and Abstracts Views on Vision4Press platform.
Data correspond to usage on the plateform after 2015. The current usage metrics is available 48-96 hours after online publication and is updated daily on week days.
Initial download of the metrics may take a while.