Open Access
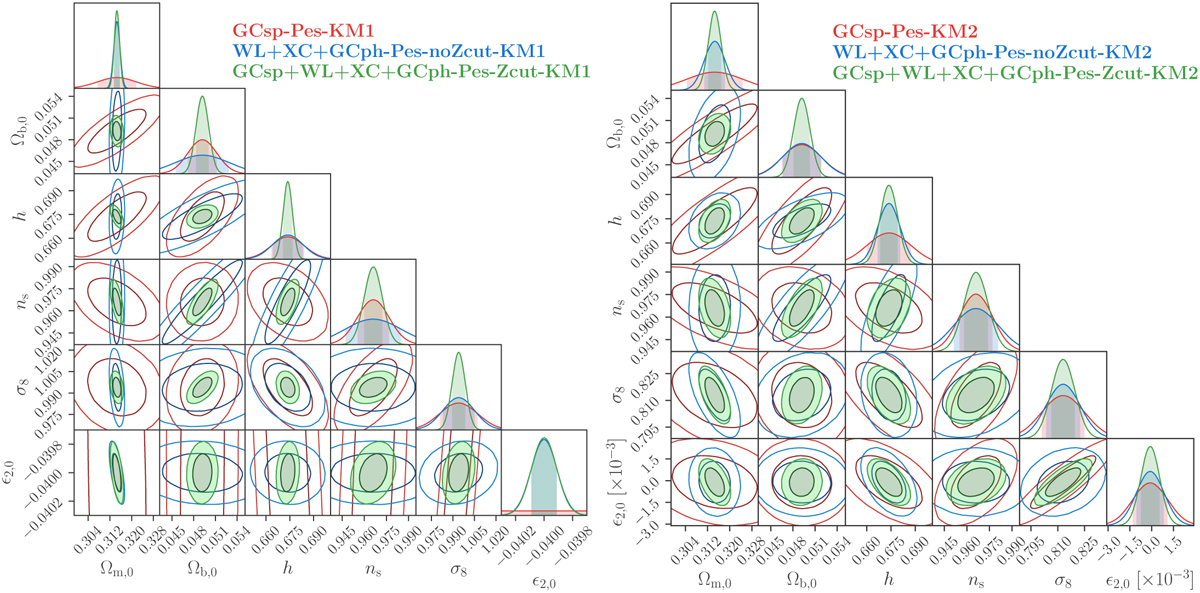
Fig. A.3
Download original image
68.3% and 95.4% joint marginal error contours on the cosmological parameters for KM1 (left panel) and KM2 (right panel) in the pessimistic case. In red, we plot GCsp, in blue, we plot WL+XC+GCph and in green, we plot GCsp+WL+XC+GCph.
Current usage metrics show cumulative count of Article Views (full-text article views including HTML views, PDF and ePub downloads, according to the available data) and Abstracts Views on Vision4Press platform.
Data correspond to usage on the plateform after 2015. The current usage metrics is available 48-96 hours after online publication and is updated daily on week days.
Initial download of the metrics may take a while.