Fig. 9.

Download original image
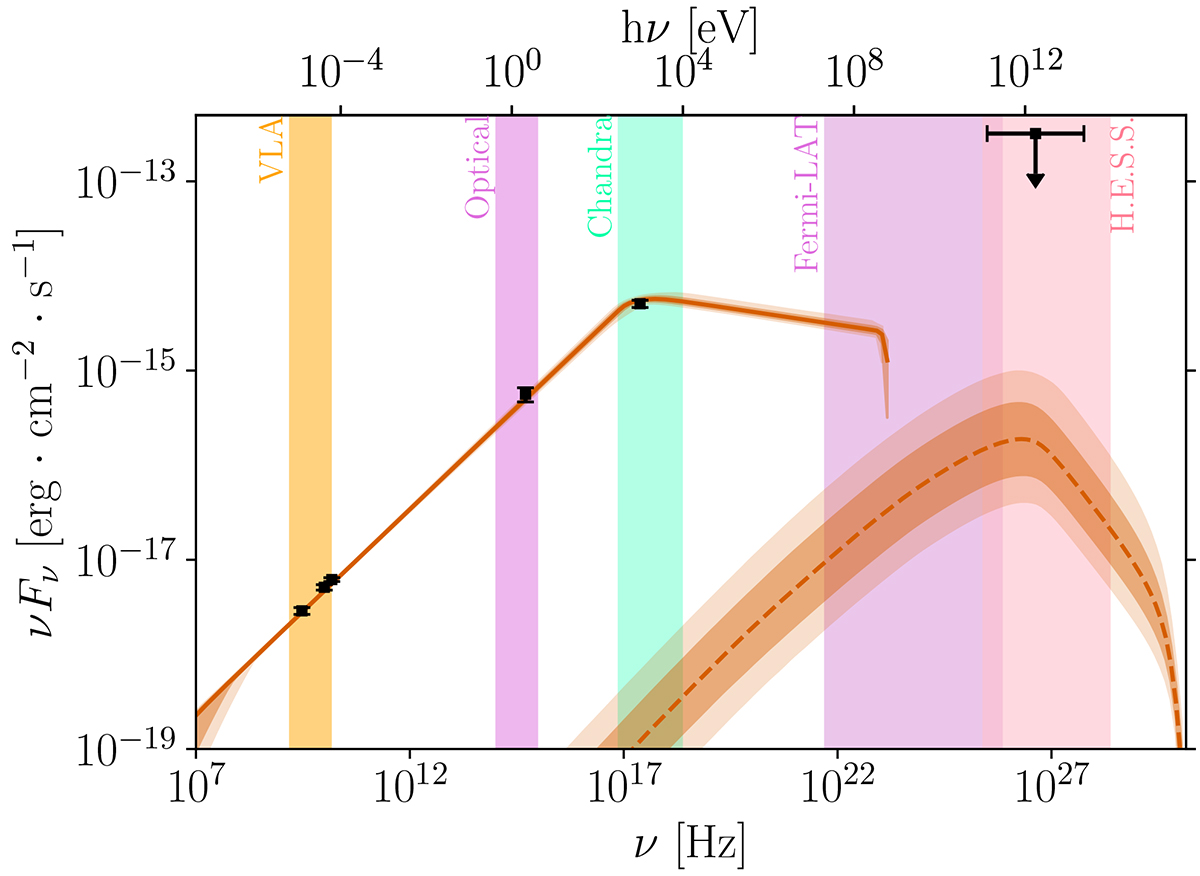
Posterior distribution of the afterglow spectrum around its peak (tobs = 110 days) for the “SSC (with KN)” fit of the afterglow of GW 170817. The data points show the multi-wavelength observations at tobs ± 4 days. The upper limit from H.E.S.S. is also indicated (Abdalla et al. 2020). The low-energy component (solid line) is produced by synchrotron radiation, while the high-energy emission (dashed line) is powered by SSC scattering. The thick lines represent the median value at each observing frequency, the dark contours show the 68% confidence interval, and the light contours present the 97.5% confidence interval. Some instrument observing spectral ranges are shown in colours.
Current usage metrics show cumulative count of Article Views (full-text article views including HTML views, PDF and ePub downloads, according to the available data) and Abstracts Views on Vision4Press platform.
Data correspond to usage on the plateform after 2015. The current usage metrics is available 48-96 hours after online publication and is updated daily on week days.
Initial download of the metrics may take a while.


