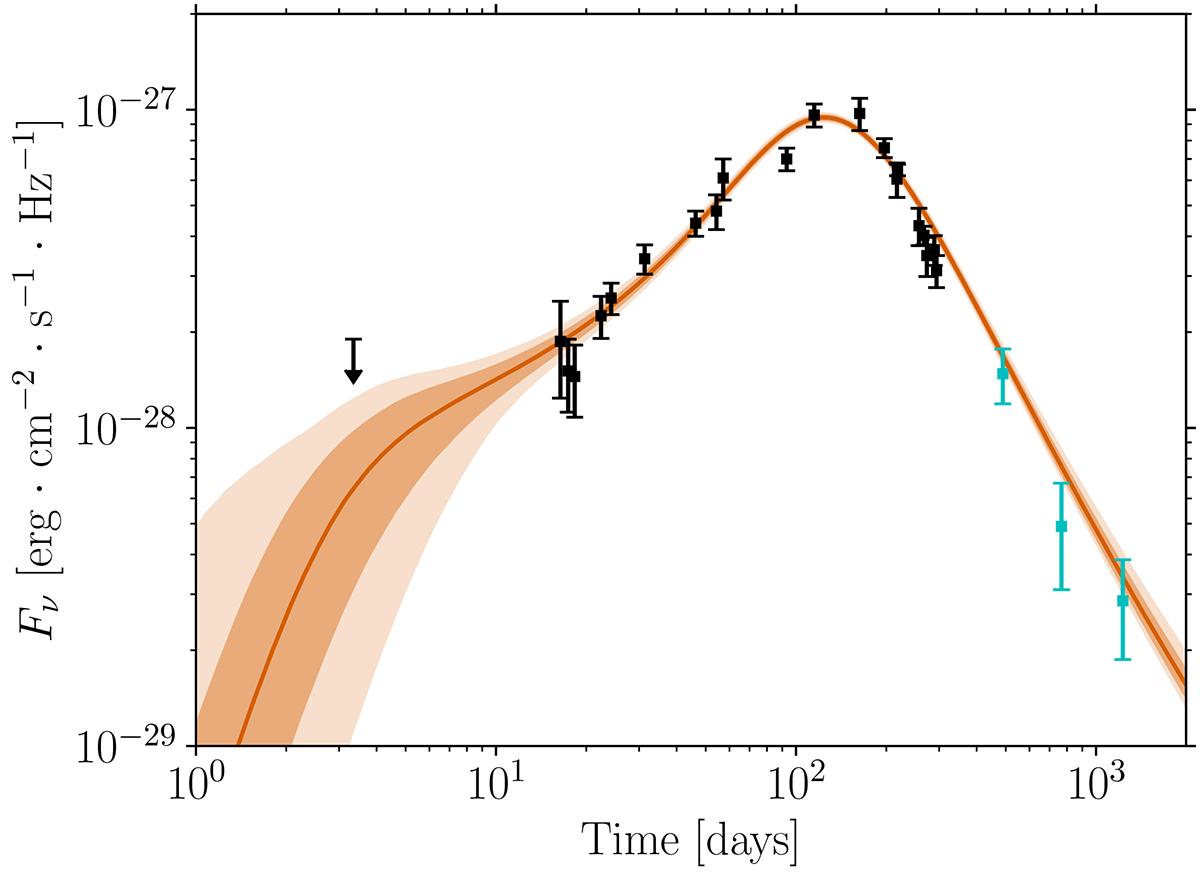
Fig. 7.
Download original image
Posterior distribution of the radio light curves at νobs = 3 GHz for the “SSC (with KN)” fit of the afterglow of GW 170817. The solid lines represent the median value at each observing time, the dark contours are the 68% confidence interval, and the light contours show the 97.5% confidence interval. Late-time observations that were not used in the fit are shown in blue.
Current usage metrics show cumulative count of Article Views (full-text article views including HTML views, PDF and ePub downloads, according to the available data) and Abstracts Views on Vision4Press platform.
Data correspond to usage on the plateform after 2015. The current usage metrics is available 48-96 hours after online publication and is updated daily on week days.
Initial download of the metrics may take a while.