Fig. 4.
Download original image
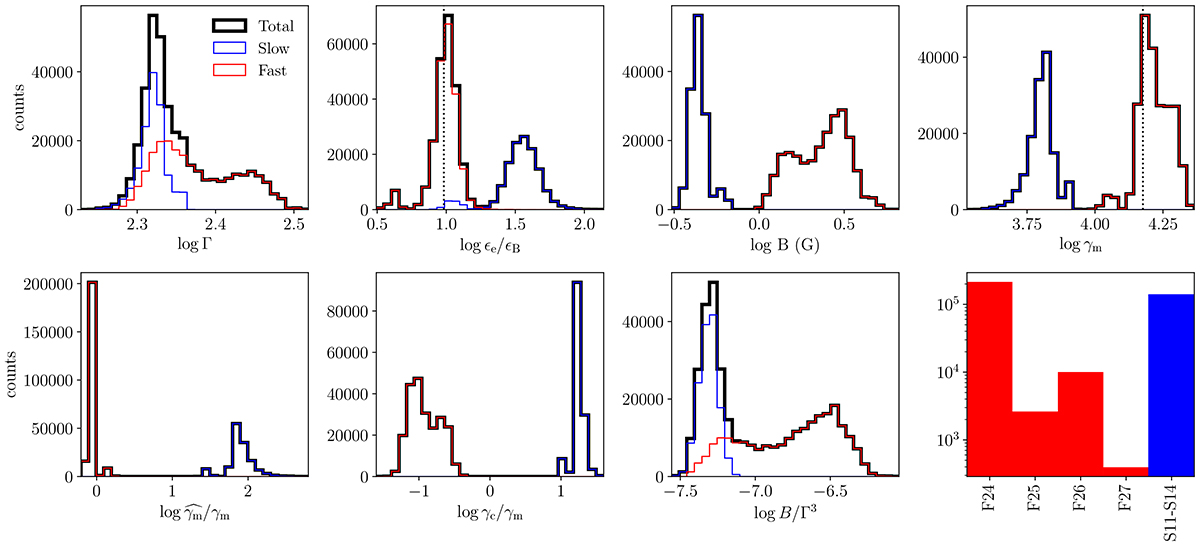
Marginalised posterior distributions for the spectral fit of the afterglow observations of GRB 190114C at tobs = 90 s. The total (black) is subdivided between the slow (blue) and fast (red) cooling cases. The first row shows the four free parameters explored in this MCMC analysis (Γ, ϵe/ϵB, B and γm). In the second row, we show some derived quantities: ![]() , γc/γm and B/Γ3. The bottom right panel shows the distribution of the radiative regimes found in the posterior sample (see Appendix B for their description). The best-fit model for each radiative regime is shown in Fig. 3.
, γc/γm and B/Γ3. The bottom right panel shows the distribution of the radiative regimes found in the posterior sample (see Appendix B for their description). The best-fit model for each radiative regime is shown in Fig. 3.
Current usage metrics show cumulative count of Article Views (full-text article views including HTML views, PDF and ePub downloads, according to the available data) and Abstracts Views on Vision4Press platform.
Data correspond to usage on the plateform after 2015. The current usage metrics is available 48-96 hours after online publication and is updated daily on week days.
Initial download of the metrics may take a while.