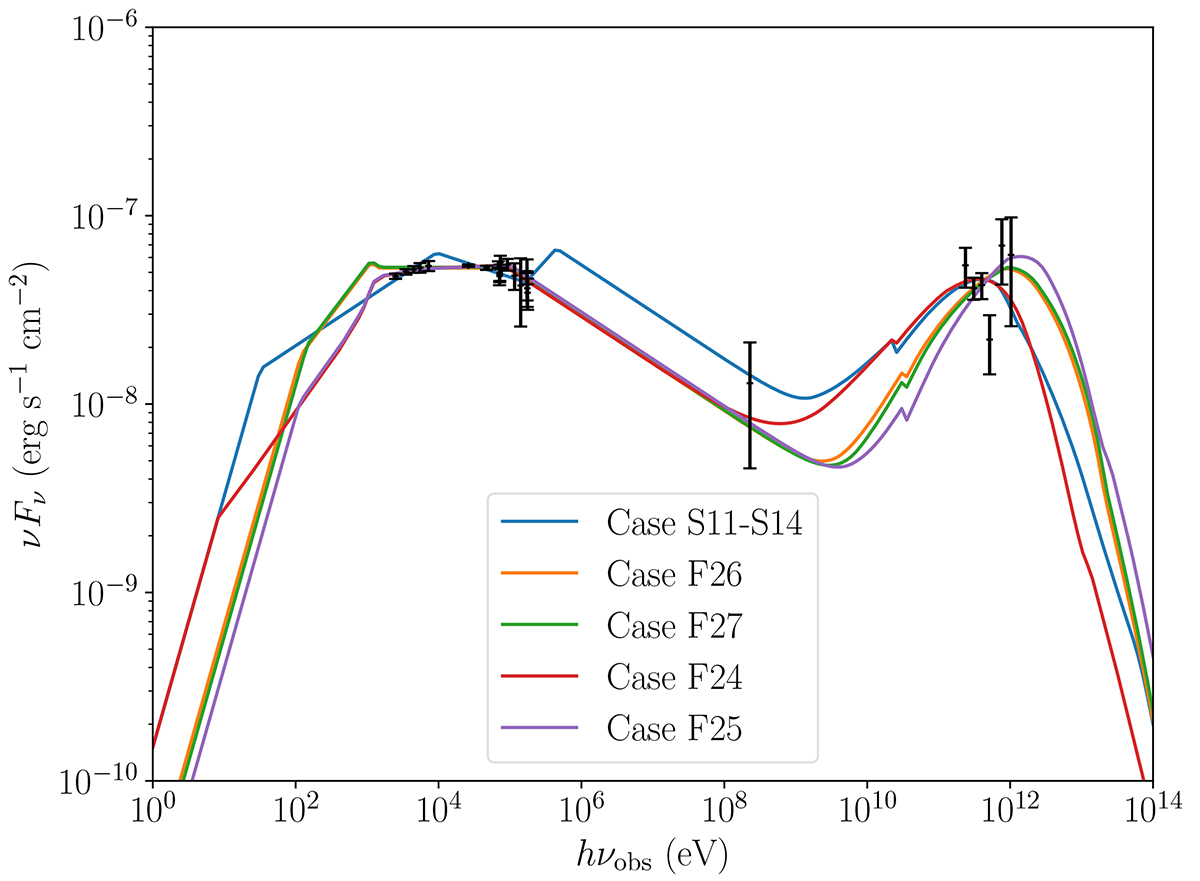
Fig. 3.
Download original image
Spectral fits to the afterglow observations of GRB 190114C at 90 s (black data points taken from MAGIC Collaboration 2019b). Each colour represents the best-fit spectrum for each of the possible radiative regimes (see text and Fig. 4). The spectral cases are detailed in Appendix B. This figure can be compared to Fig. 6 in Yamasaki & Piran (2022), which shows very similar fits.
Current usage metrics show cumulative count of Article Views (full-text article views including HTML views, PDF and ePub downloads, according to the available data) and Abstracts Views on Vision4Press platform.
Data correspond to usage on the plateform after 2015. The current usage metrics is available 48-96 hours after online publication and is updated daily on week days.
Initial download of the metrics may take a while.