Fig. B.1.
Download original image
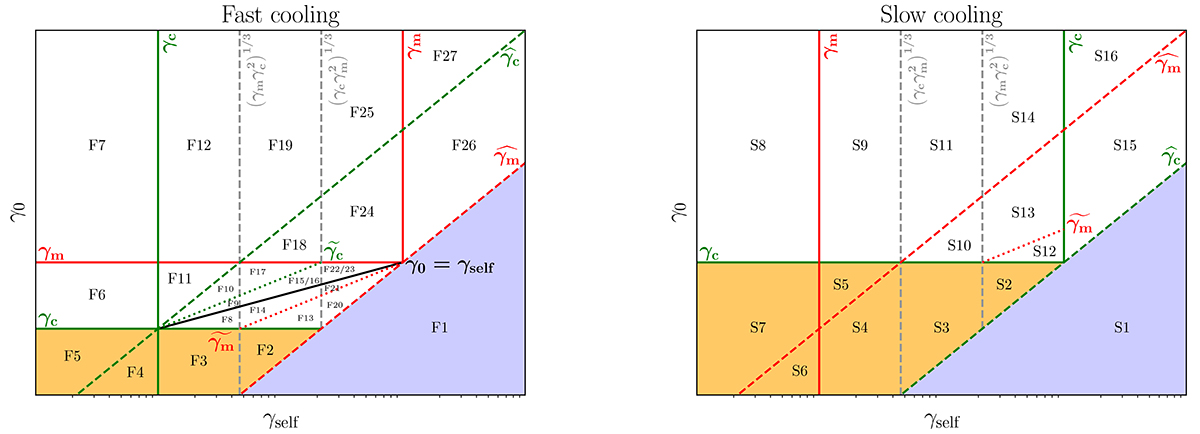
Definition of all possible cases for the radiative regime and the distribution of electrons in the plane γ0 vs γself. The Lorentz factors γm and γc are indicated by red and green solid lines either in the fast-cooling regime with γm > γc (left) or in the slow-cooling regime with γm < γc (right). The black solid line in the left panel corresponds to γ0 = γself. The two Lorentz factors ![]() (red) and
(red) and ![]() (green) are plotted in dashed lines. In some regions, additional Lorentz factors relevant to identify the radiative regime are also plotted:
(green) are plotted in dashed lines. In some regions, additional Lorentz factors relevant to identify the radiative regime are also plotted: ![]() (red dotted line) and
(red dotted line) and ![]() (green dotted line). The regions where there is no impact of the SSC cooling on the distribution of electrons are shaded in orange (
(green dotted line). The regions where there is no impact of the SSC cooling on the distribution of electrons are shaded in orange (![]() ) and blue (
) and blue (![]() ). This diagram allows to identify all possible orderings of γ0, γm, γc,
). This diagram allows to identify all possible orderings of γ0, γm, γc, ![]() ,
, ![]() defining all possible radiative regimes. The corresponding limits for γself are indicated by vertical black dashed lines. All the possible cases are listed in Table B.1 (fast cooling) and B.2 (slow cooling). In practice, several cases have the same breaks and slopes for f(x) and h(x) and can therefore be treated simultaneously in the numerical implementation of the model. This allows to group (F1,F2,F3,F4,F5), (F8,F13,F14), (F9,F15,F16), (F10,F17), (F20,F21), (F22,F23), (S1,S2,S3,S4,S5,S6,S7), (S8,S9), (S10,S12,S13) and (S11,S14).
defining all possible radiative regimes. The corresponding limits for γself are indicated by vertical black dashed lines. All the possible cases are listed in Table B.1 (fast cooling) and B.2 (slow cooling). In practice, several cases have the same breaks and slopes for f(x) and h(x) and can therefore be treated simultaneously in the numerical implementation of the model. This allows to group (F1,F2,F3,F4,F5), (F8,F13,F14), (F9,F15,F16), (F10,F17), (F20,F21), (F22,F23), (S1,S2,S3,S4,S5,S6,S7), (S8,S9), (S10,S12,S13) and (S11,S14).
Current usage metrics show cumulative count of Article Views (full-text article views including HTML views, PDF and ePub downloads, according to the available data) and Abstracts Views on Vision4Press platform.
Data correspond to usage on the plateform after 2015. The current usage metrics is available 48-96 hours after online publication and is updated daily on week days.
Initial download of the metrics may take a while.