Fig. 14.
Download original image
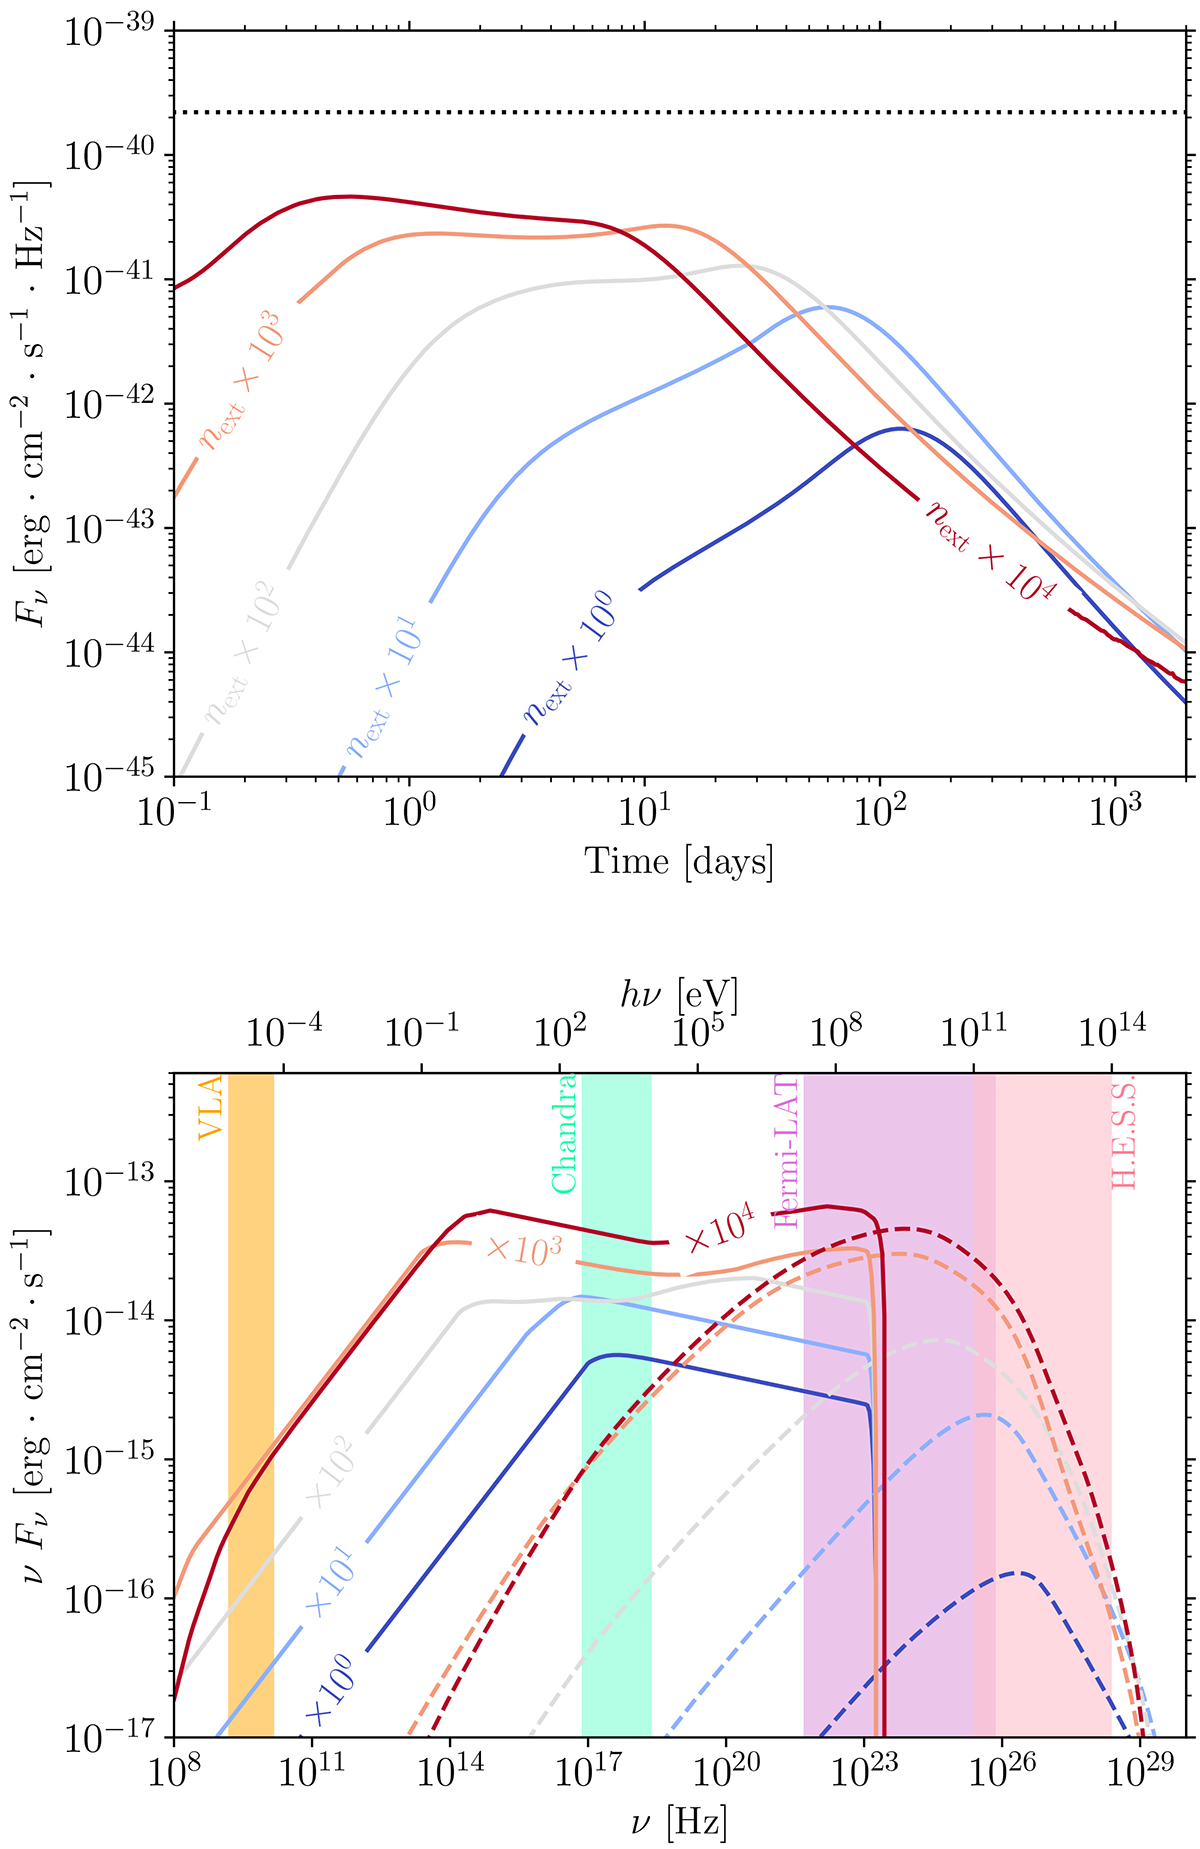
Light curves at 1 TeV (top panel) and spectra at light-curve peak (bottom panel) of the moderate reference case (see Table 6) for varying external medium densities next. The case fitting the afterglow of GW 170817 corresponds to next = 4.25 × 10⁻³ cm−3. Each line is labelled with the multiplication factor applied to the reference next. The peak times at which spectra are calculated are 123, 60, 26, 12, and 0.55 days. The dotted line in the top panel corresponds to the assumed CTA sensitivity in Sect. 5.
Current usage metrics show cumulative count of Article Views (full-text article views including HTML views, PDF and ePub downloads, according to the available data) and Abstracts Views on Vision4Press platform.
Data correspond to usage on the plateform after 2015. The current usage metrics is available 48-96 hours after online publication and is updated daily on week days.
Initial download of the metrics may take a while.