Fig. 11.
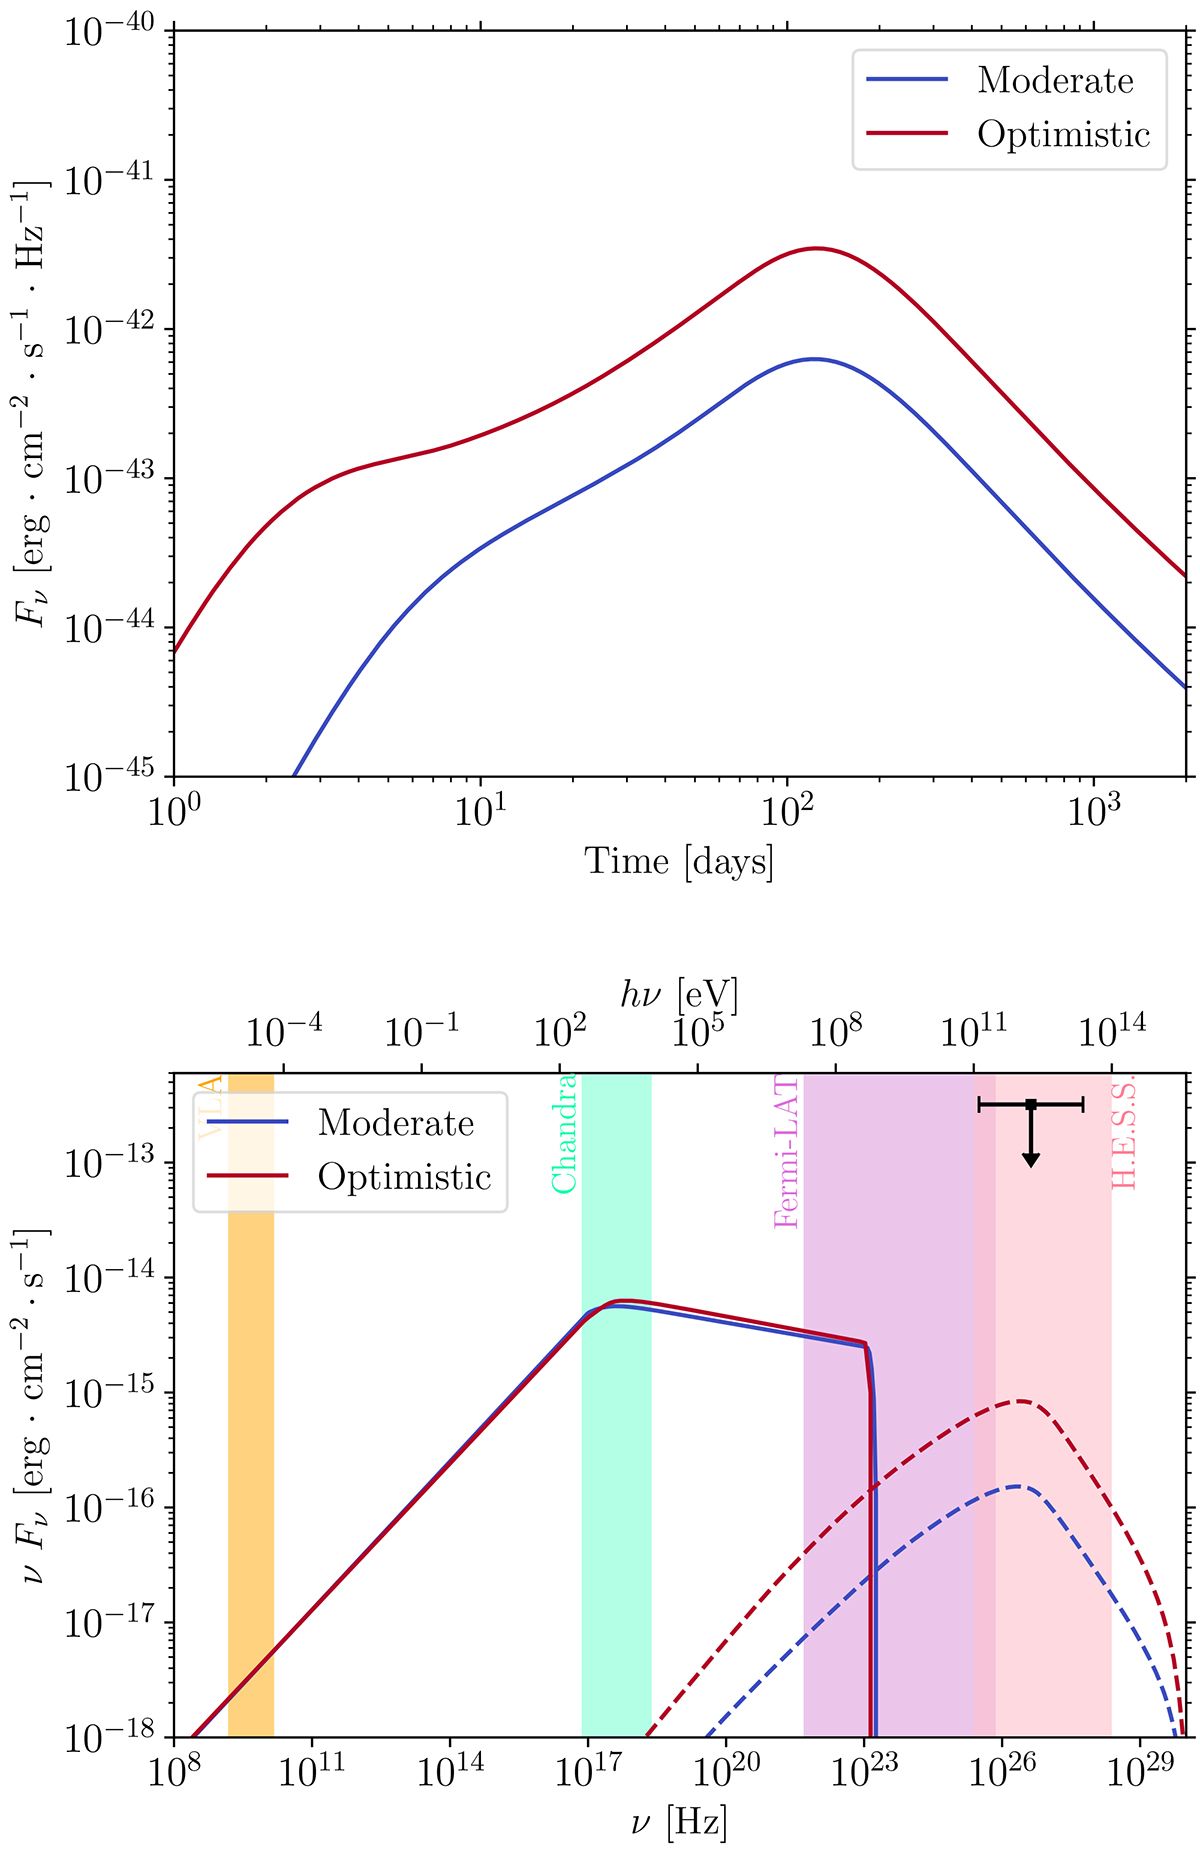
Download original image
VHE light curve at hνobs = 1 TeV (top) and spectrum around the peak at tobs = 110 days (bottom) for the moderate (in blue) and optimistic (in red) reference cases (see Table 6). Both predict similar fluxes in the synchrotron range due to the observational constraints, but they differ in the SSC regime. The upper limit from H.E.S.S. is indicated for comparison (Abdalla et al. 2020).
Current usage metrics show cumulative count of Article Views (full-text article views including HTML views, PDF and ePub downloads, according to the available data) and Abstracts Views on Vision4Press platform.
Data correspond to usage on the plateform after 2015. The current usage metrics is available 48-96 hours after online publication and is updated daily on week days.
Initial download of the metrics may take a while.