Open Access
Fig. 10.
Download original image
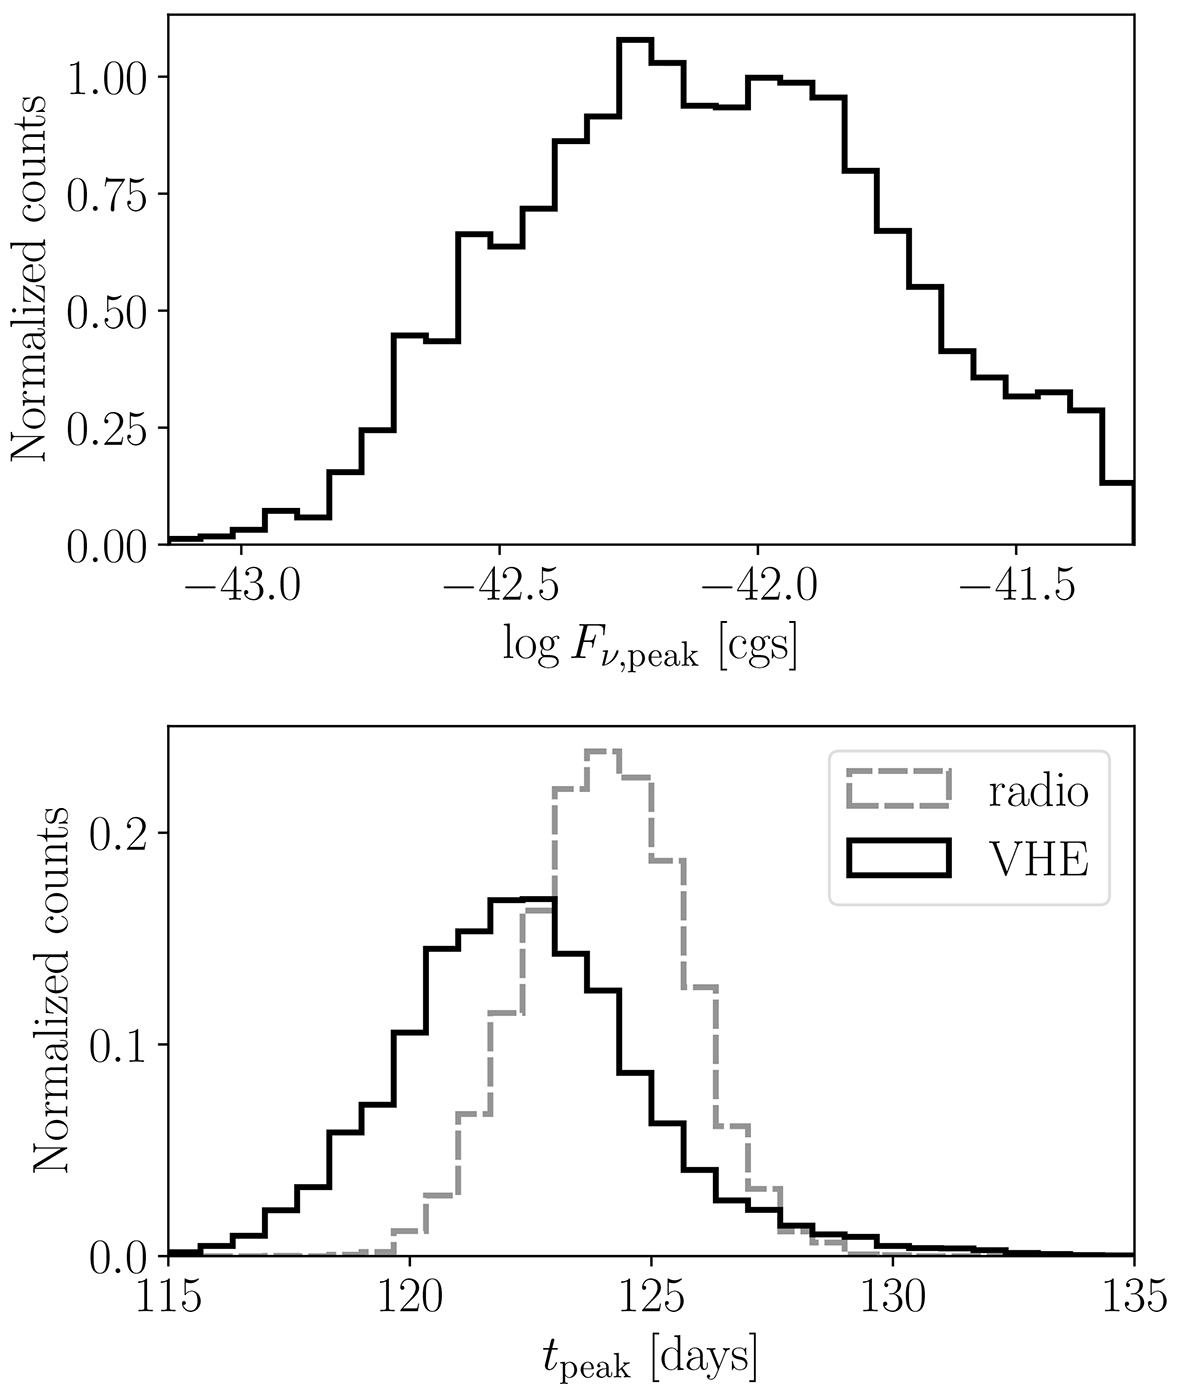
Posterior distributions of the VHE peak flux density (top) and the radio (dashed grey line) and VHE (solid black line) peak times (bottom) for the “SSC (with KN)” fit of the afterglow of GW 170817.
Current usage metrics show cumulative count of Article Views (full-text article views including HTML views, PDF and ePub downloads, according to the available data) and Abstracts Views on Vision4Press platform.
Data correspond to usage on the plateform after 2015. The current usage metrics is available 48-96 hours after online publication and is updated daily on week days.
Initial download of the metrics may take a while.