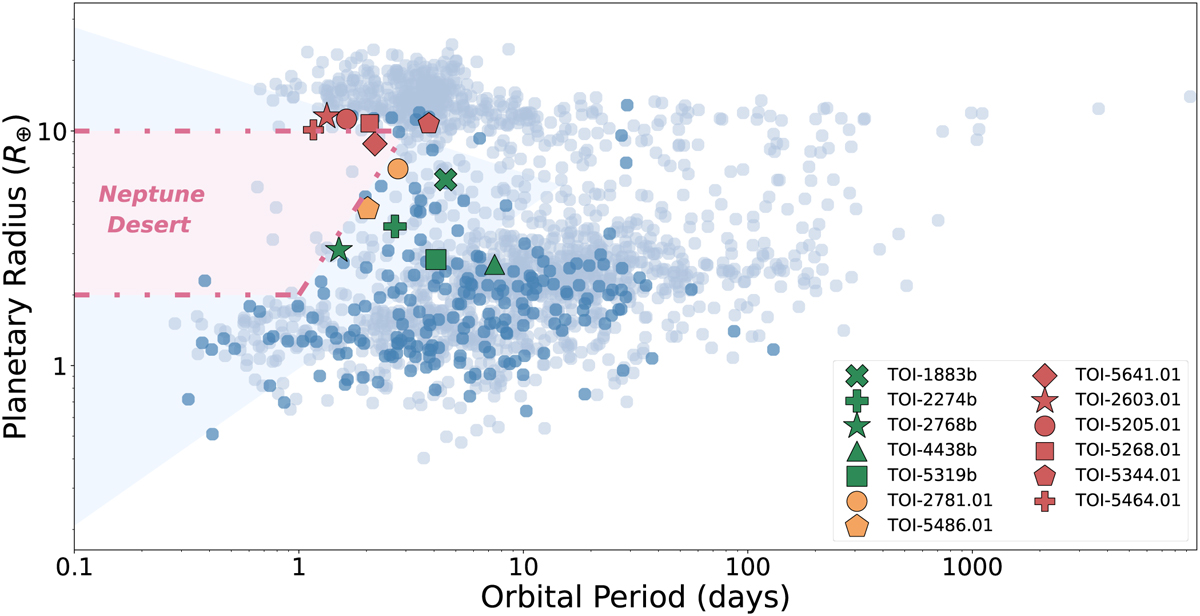
Fig. 2

Download original image
Location of the validated and non-validated planet candidates in the period-radius diagram. The red polygons show the non-validated candidates, the dark-green polygons show the validated planets, and the orange polygons show the candidates which validation status is only suggestive. The grey circles show the population of all validated planets with radius uncertainties below 10%, and the blue circles highlight those planets orbiting M-type stars. The blue-shaded region shows the Neptune desert as defined by Mazeh et al. (2016). However, in recent years, this region has become more populated, and the boundaries of the desert do not match the typical definitions any longer. Thus, we suggest the pink-shaded area, where the scarcity of planets is noteworthy, as an updated definition of the Neptune desert based on the current population of known planets.
Current usage metrics show cumulative count of Article Views (full-text article views including HTML views, PDF and ePub downloads, according to the available data) and Abstracts Views on Vision4Press platform.
Data correspond to usage on the plateform after 2015. The current usage metrics is available 48-96 hours after online publication and is updated daily on week days.
Initial download of the metrics may take a while.


