Fig. 1
Download original image
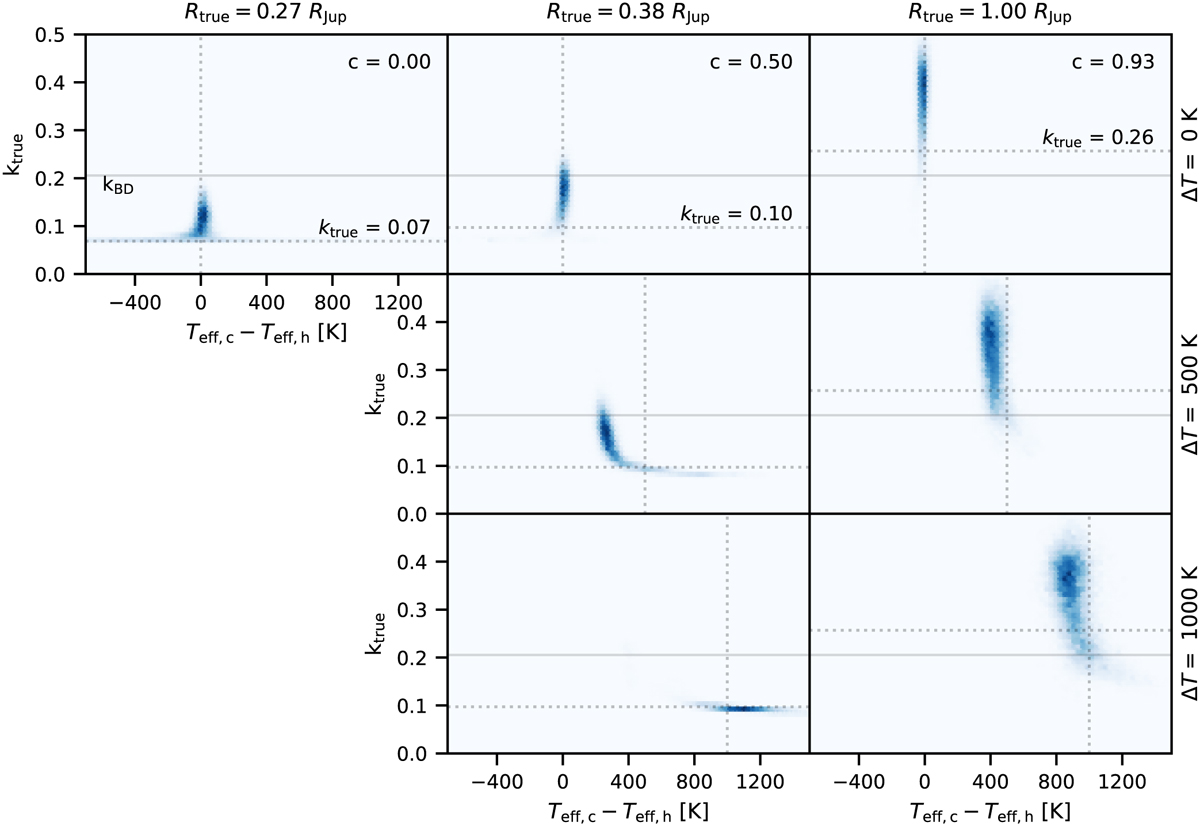
Multi-colour validation example using simulated light curves. The figure shows joint posterior distribution of the true radius ratios and the host-contaminant effective temperature difference for seven scenarios. The simulations assume an M dwarf host star with Teff = 3600 K and R* = 0.4 R⊙, a transiting object with an apparent radius of 3 R⊕, three levels of contamination (0, 0.5, 0.93), and three host-contaminant temperature differences (0 K, 500 K, 1000 K). The c = 0 scenario corresponds to an uncontaminated object, while c = 0.5 corresponds to a scenario that would be expected if the contaminating star is similar to the host star (i.e. maximum amount of contamination that can be expected without significant colour difference), and the c = 0.93 scenario corresponds to a contaminated Jupiter-sized object. The dotted vertical lines show the true ΔTeff, the dotted horizontal line shows the true radius ratio, and the solid horizontal line shows the radius ratio limit corresponding to our chosen 0.8 RJup brown dwarf radius limit.
Current usage metrics show cumulative count of Article Views (full-text article views including HTML views, PDF and ePub downloads, according to the available data) and Abstracts Views on Vision4Press platform.
Data correspond to usage on the plateform after 2015. The current usage metrics is available 48-96 hours after online publication and is updated daily on week days.
Initial download of the metrics may take a while.