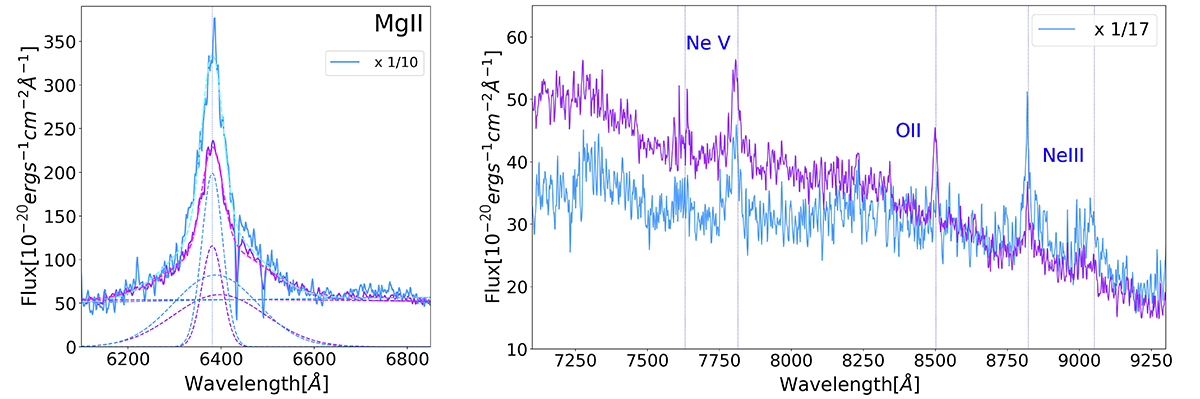
Fig. 8.
Download original image
Details of the spectra of J0402-3237, with the same color-coding of Fig. 5. Left panel: fit to the MgII line. Right panel: part of the spectrum showing several narrow lines, after multiplying the spectrum of the B component by the factor indicated in the label. Note the clear difference in the observed [OII] emission line and in the shape of the continuum.
Current usage metrics show cumulative count of Article Views (full-text article views including HTML views, PDF and ePub downloads, according to the available data) and Abstracts Views on Vision4Press platform.
Data correspond to usage on the plateform after 2015. The current usage metrics is available 48-96 hours after online publication and is updated daily on week days.
Initial download of the metrics may take a while.